


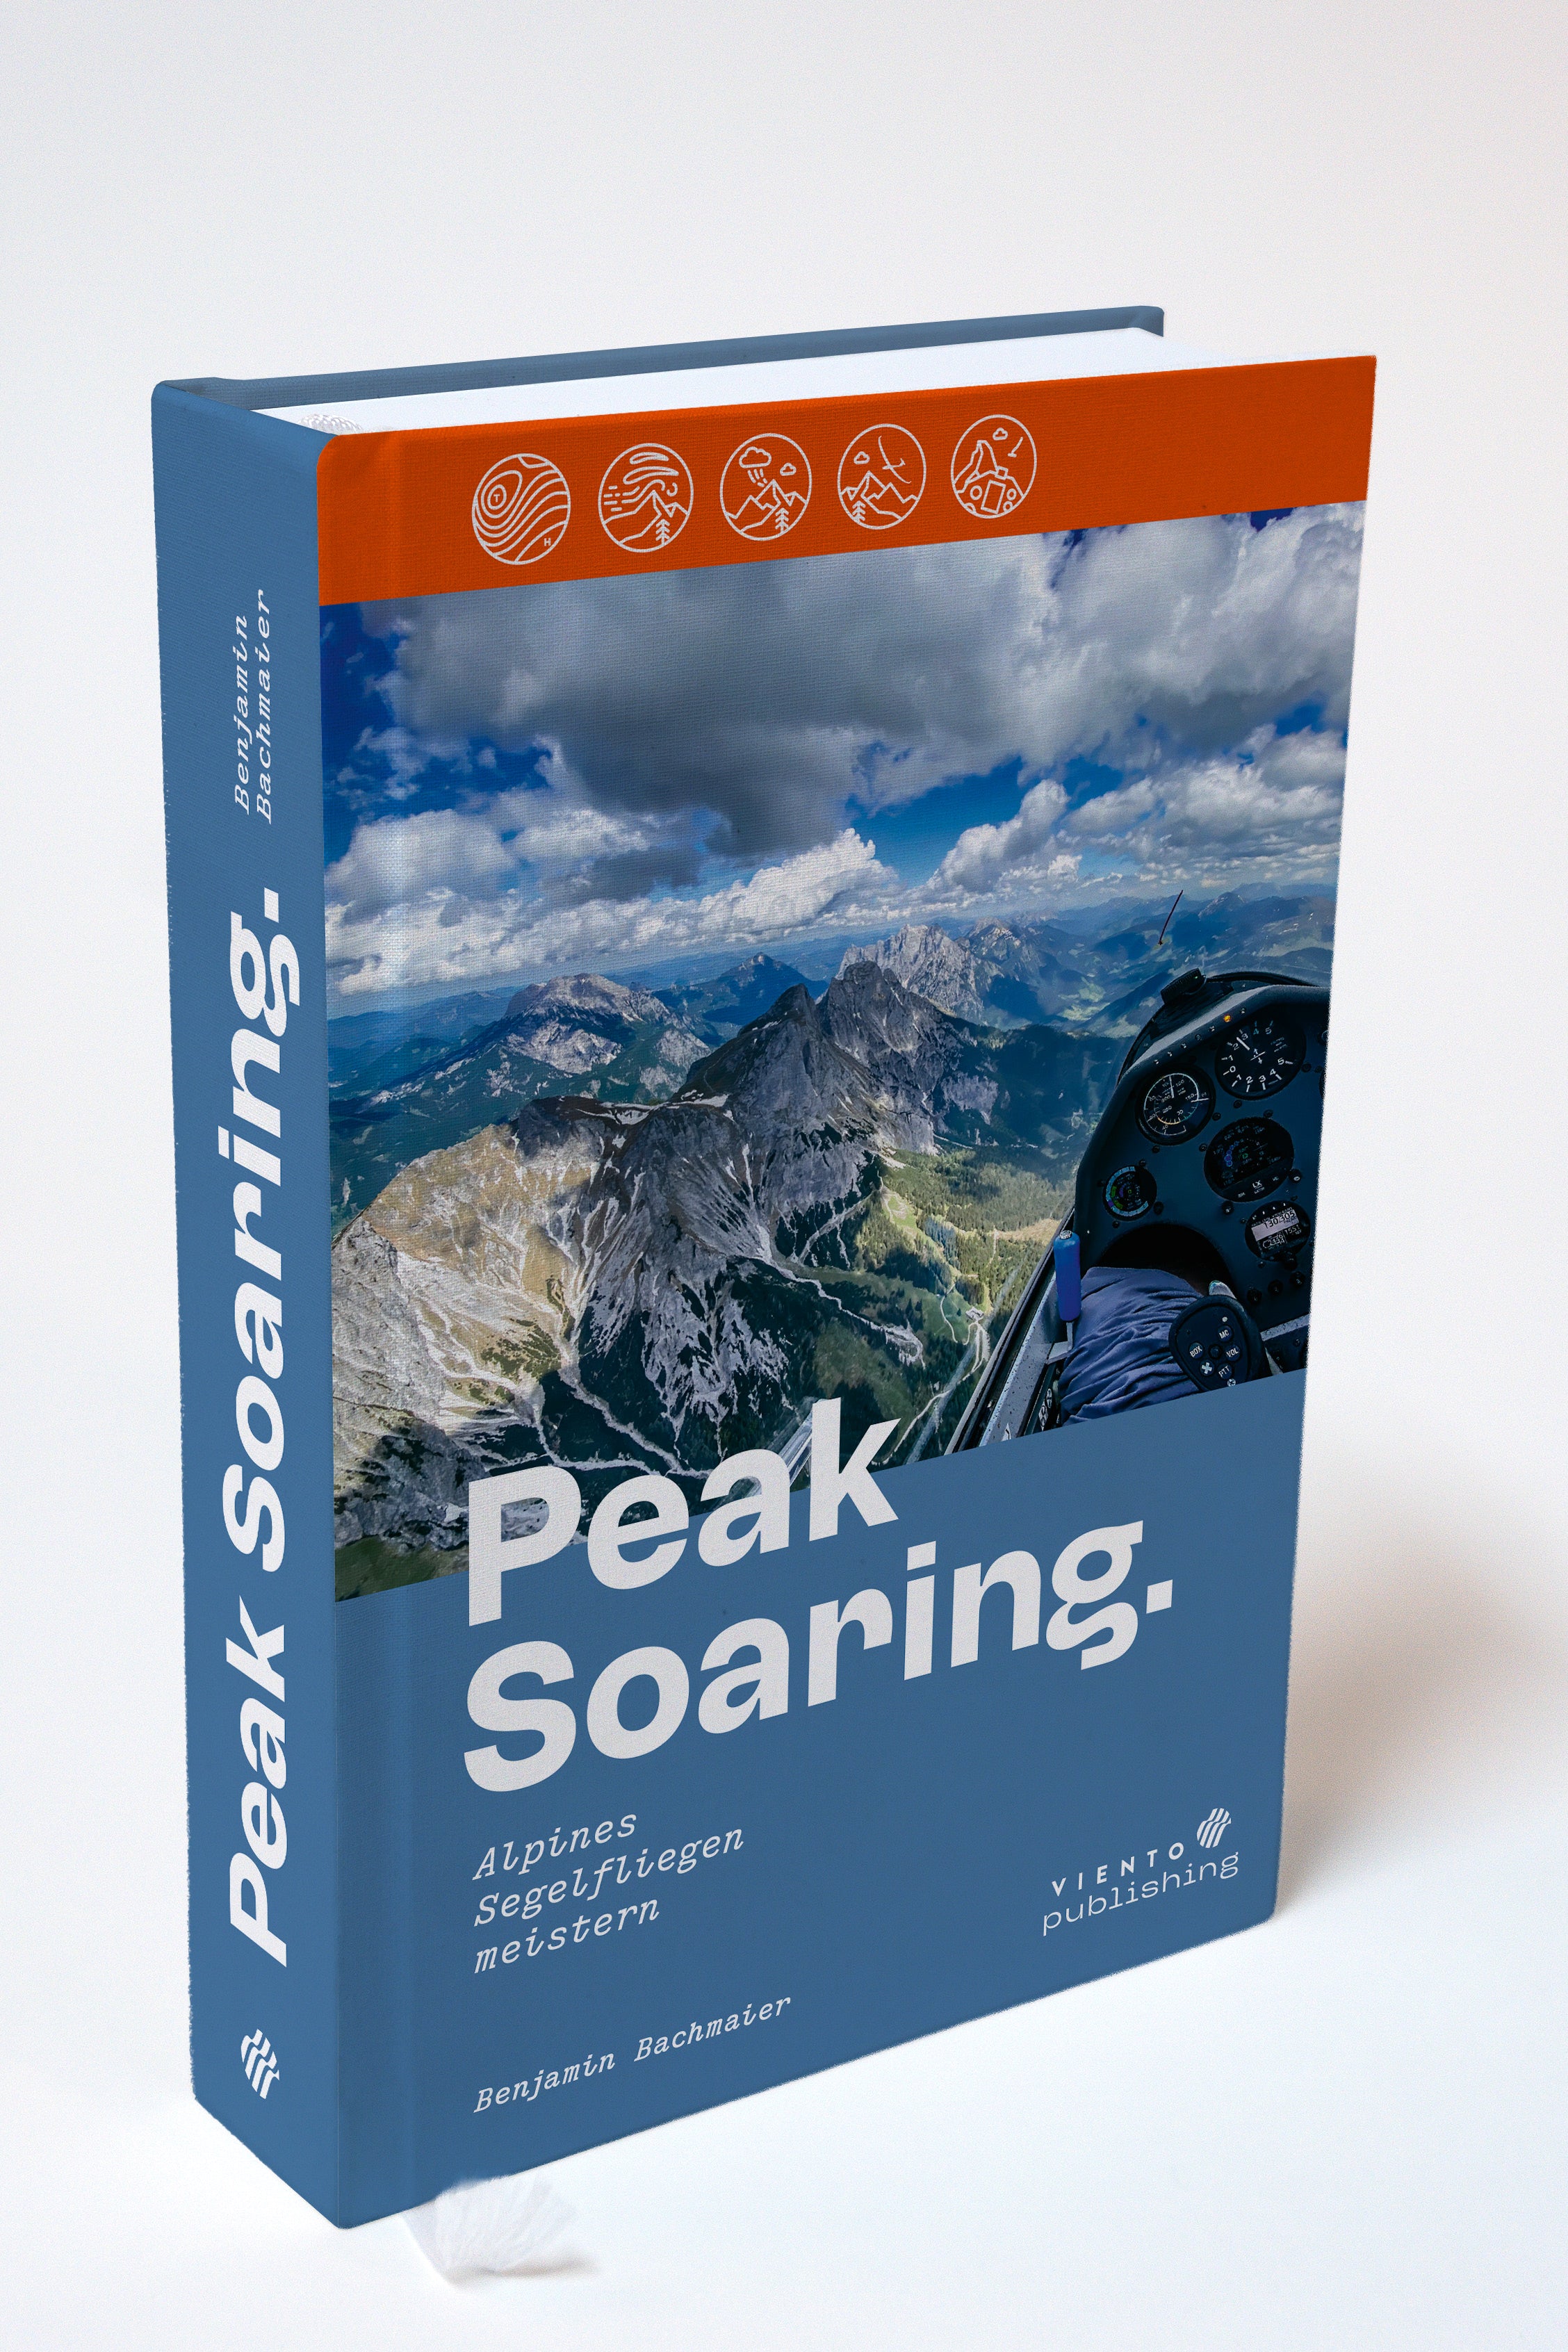


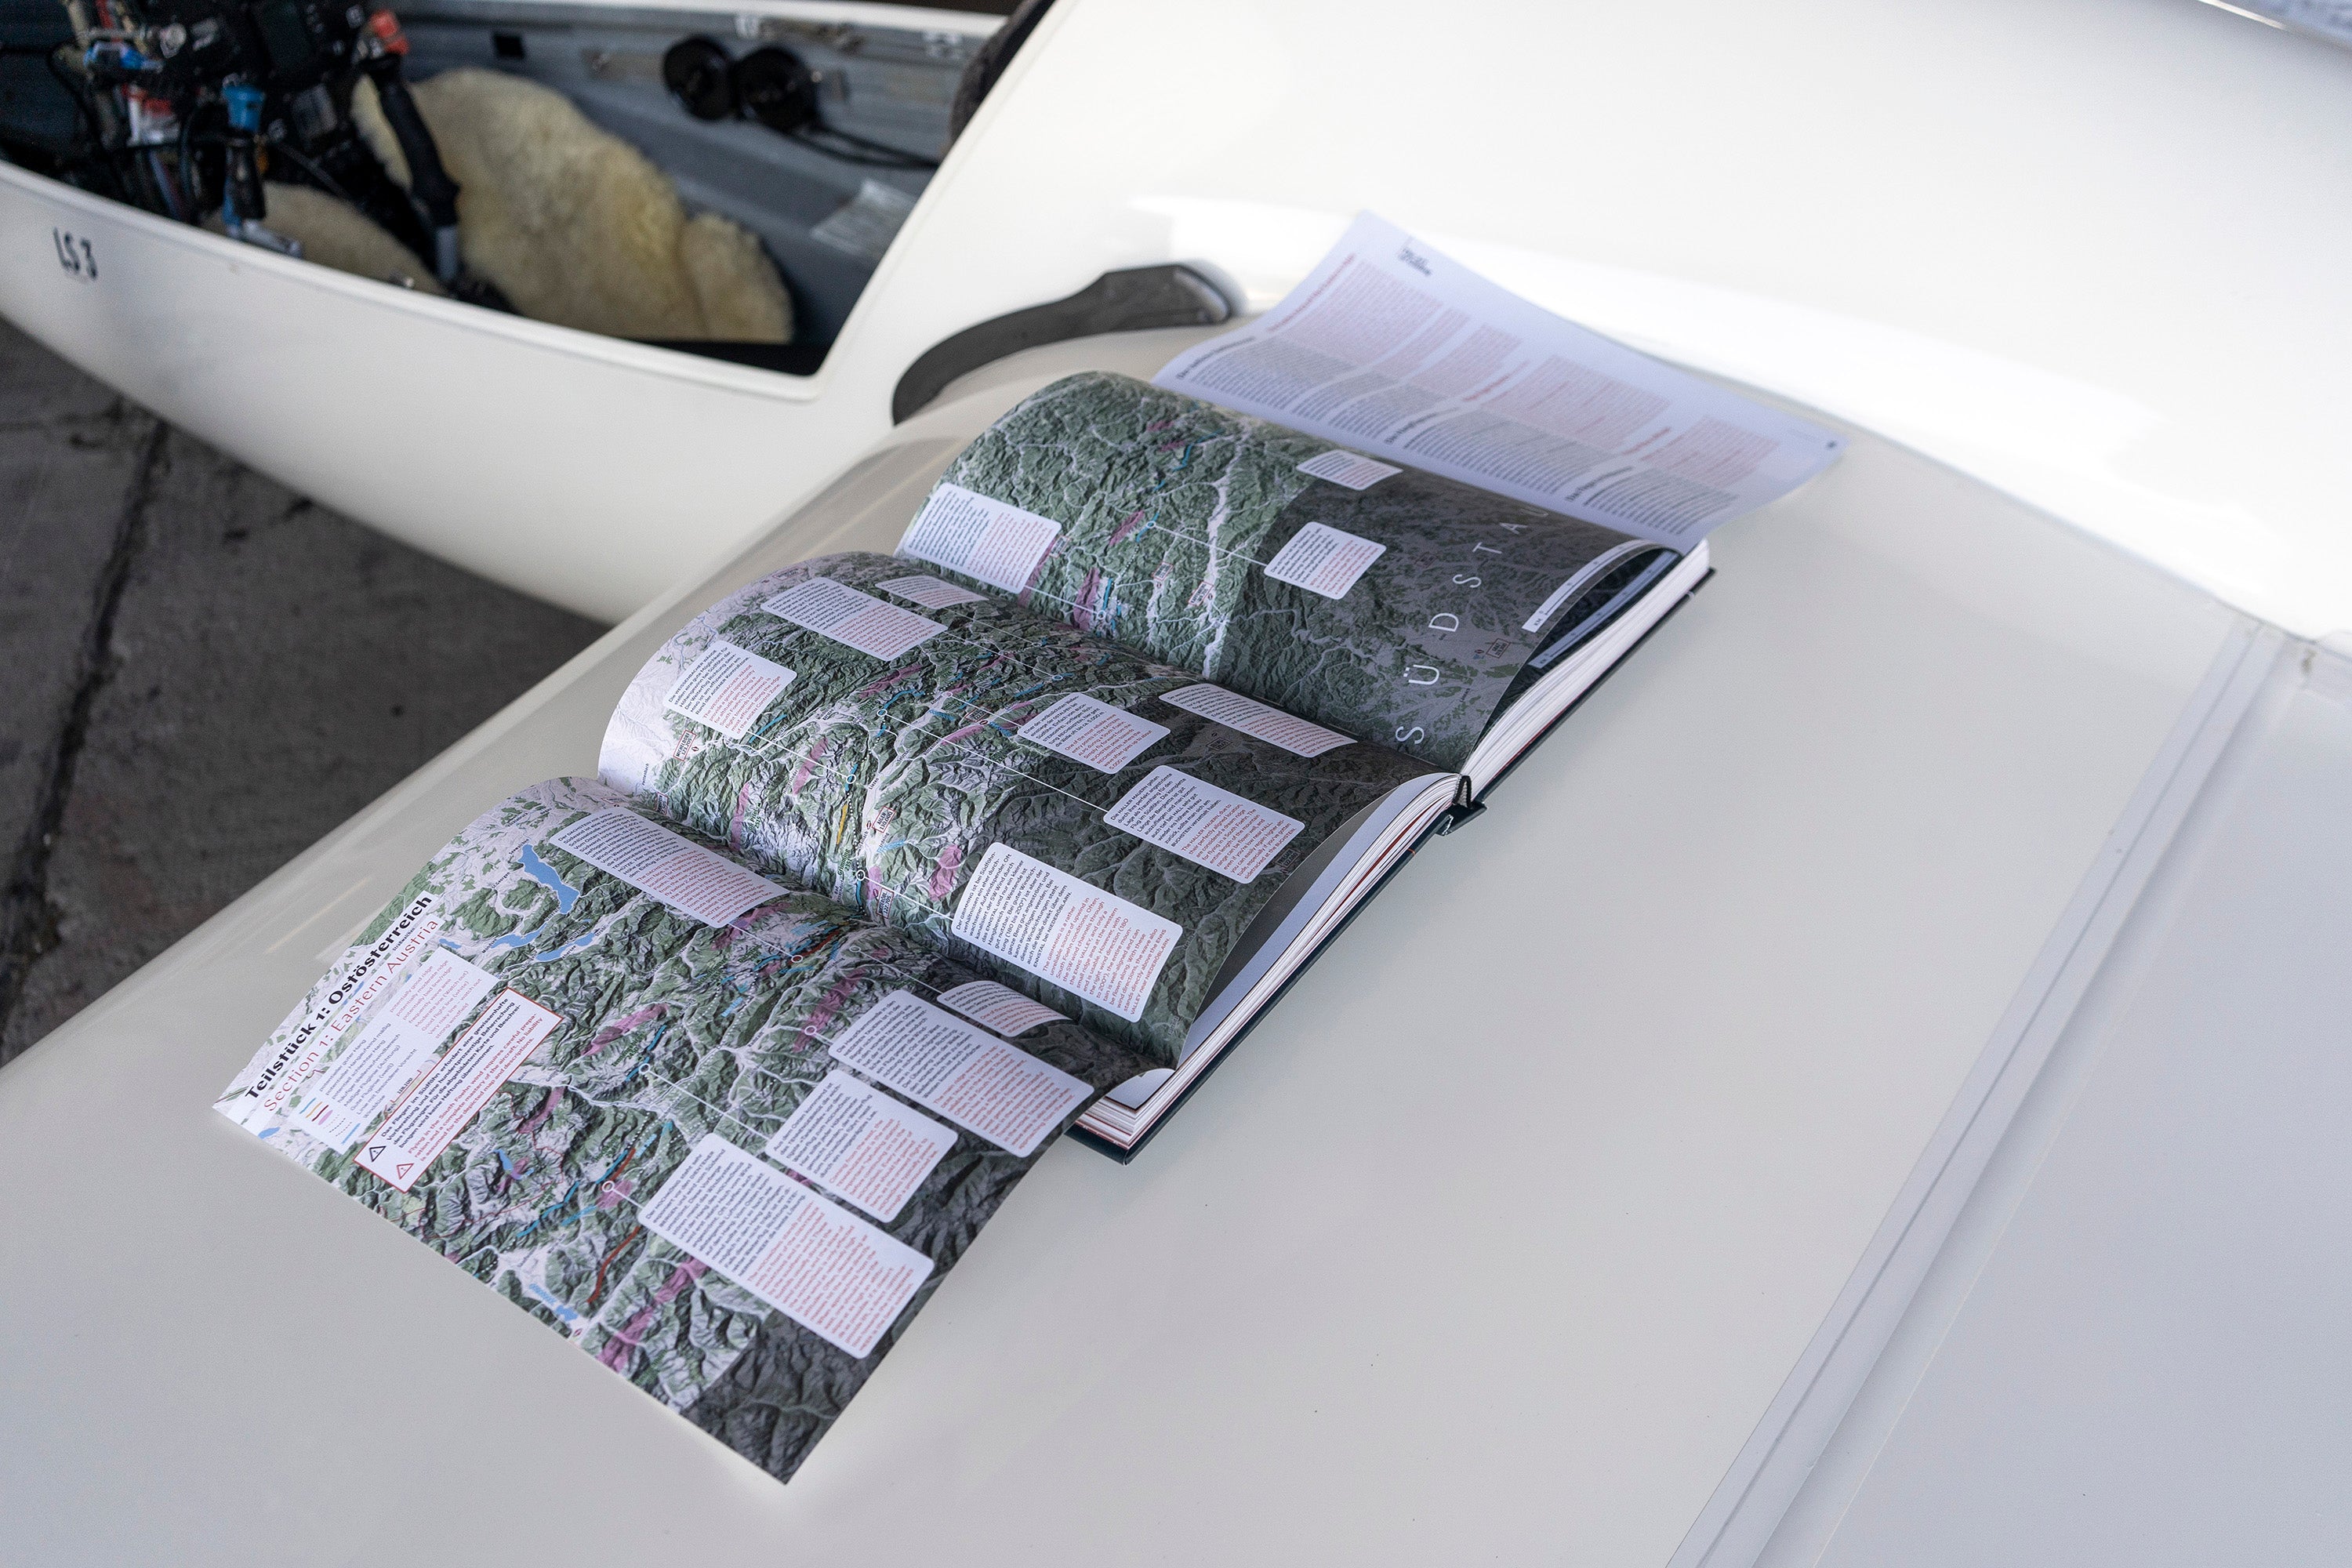


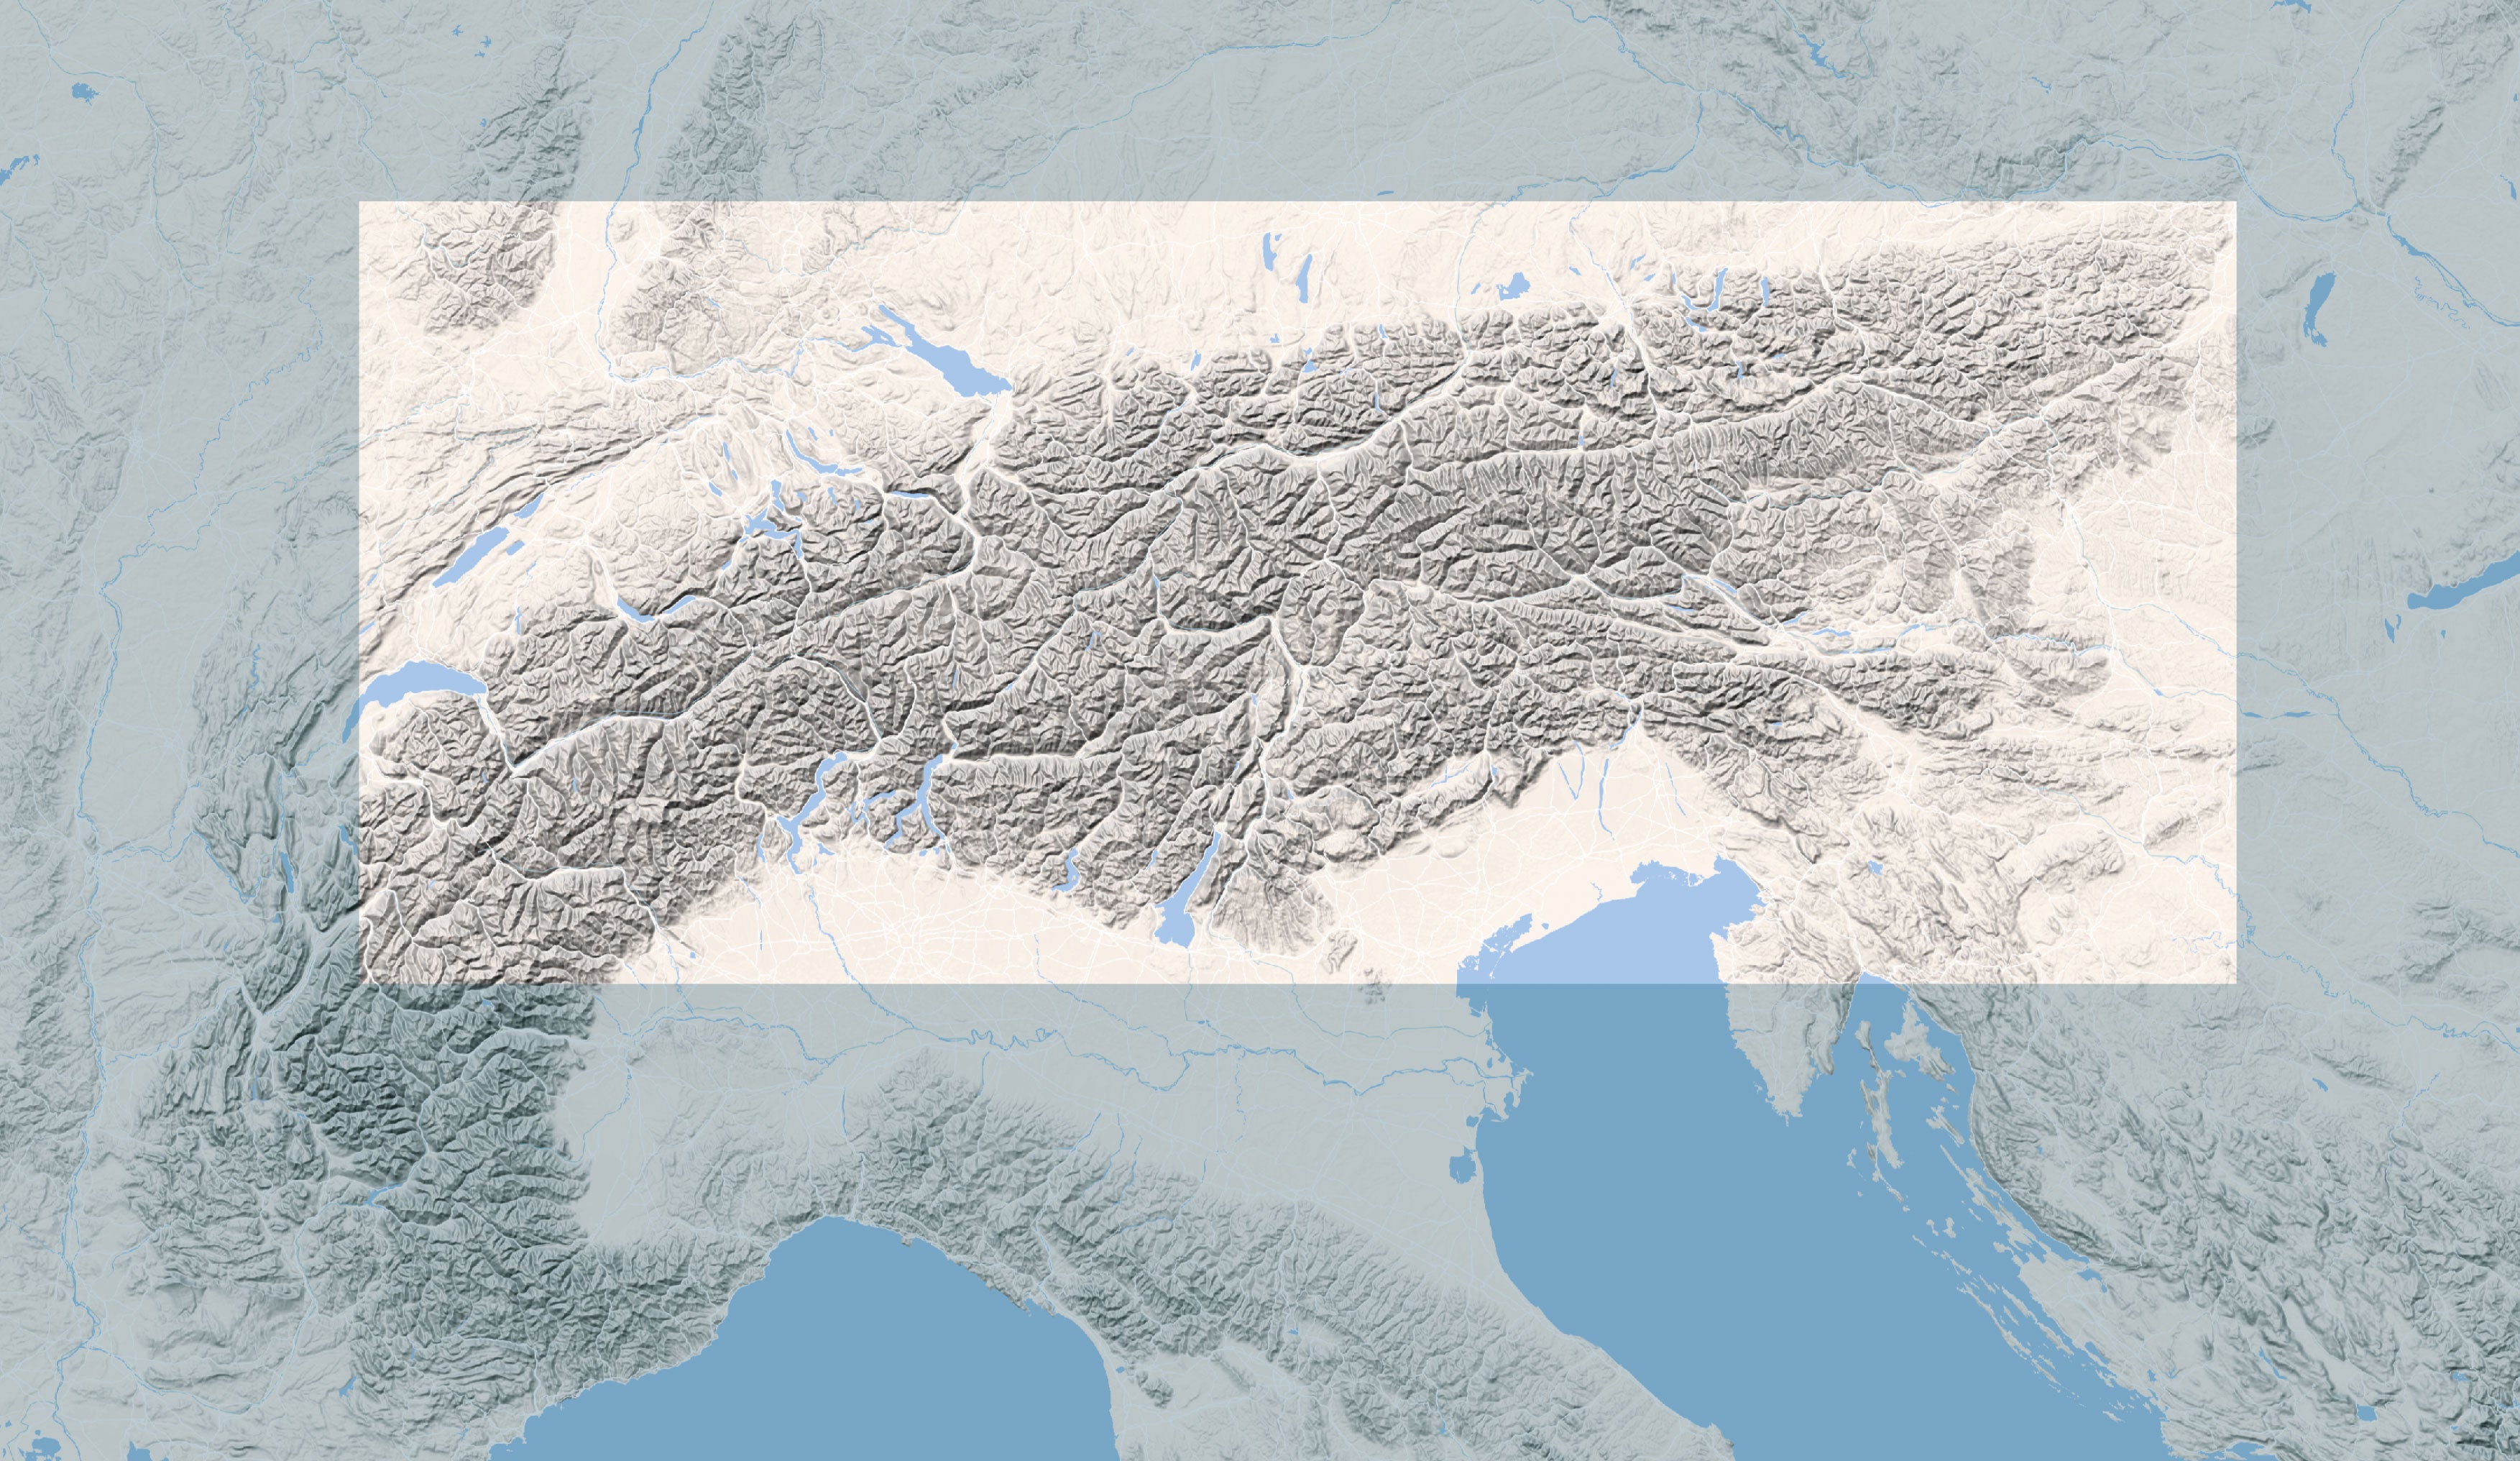
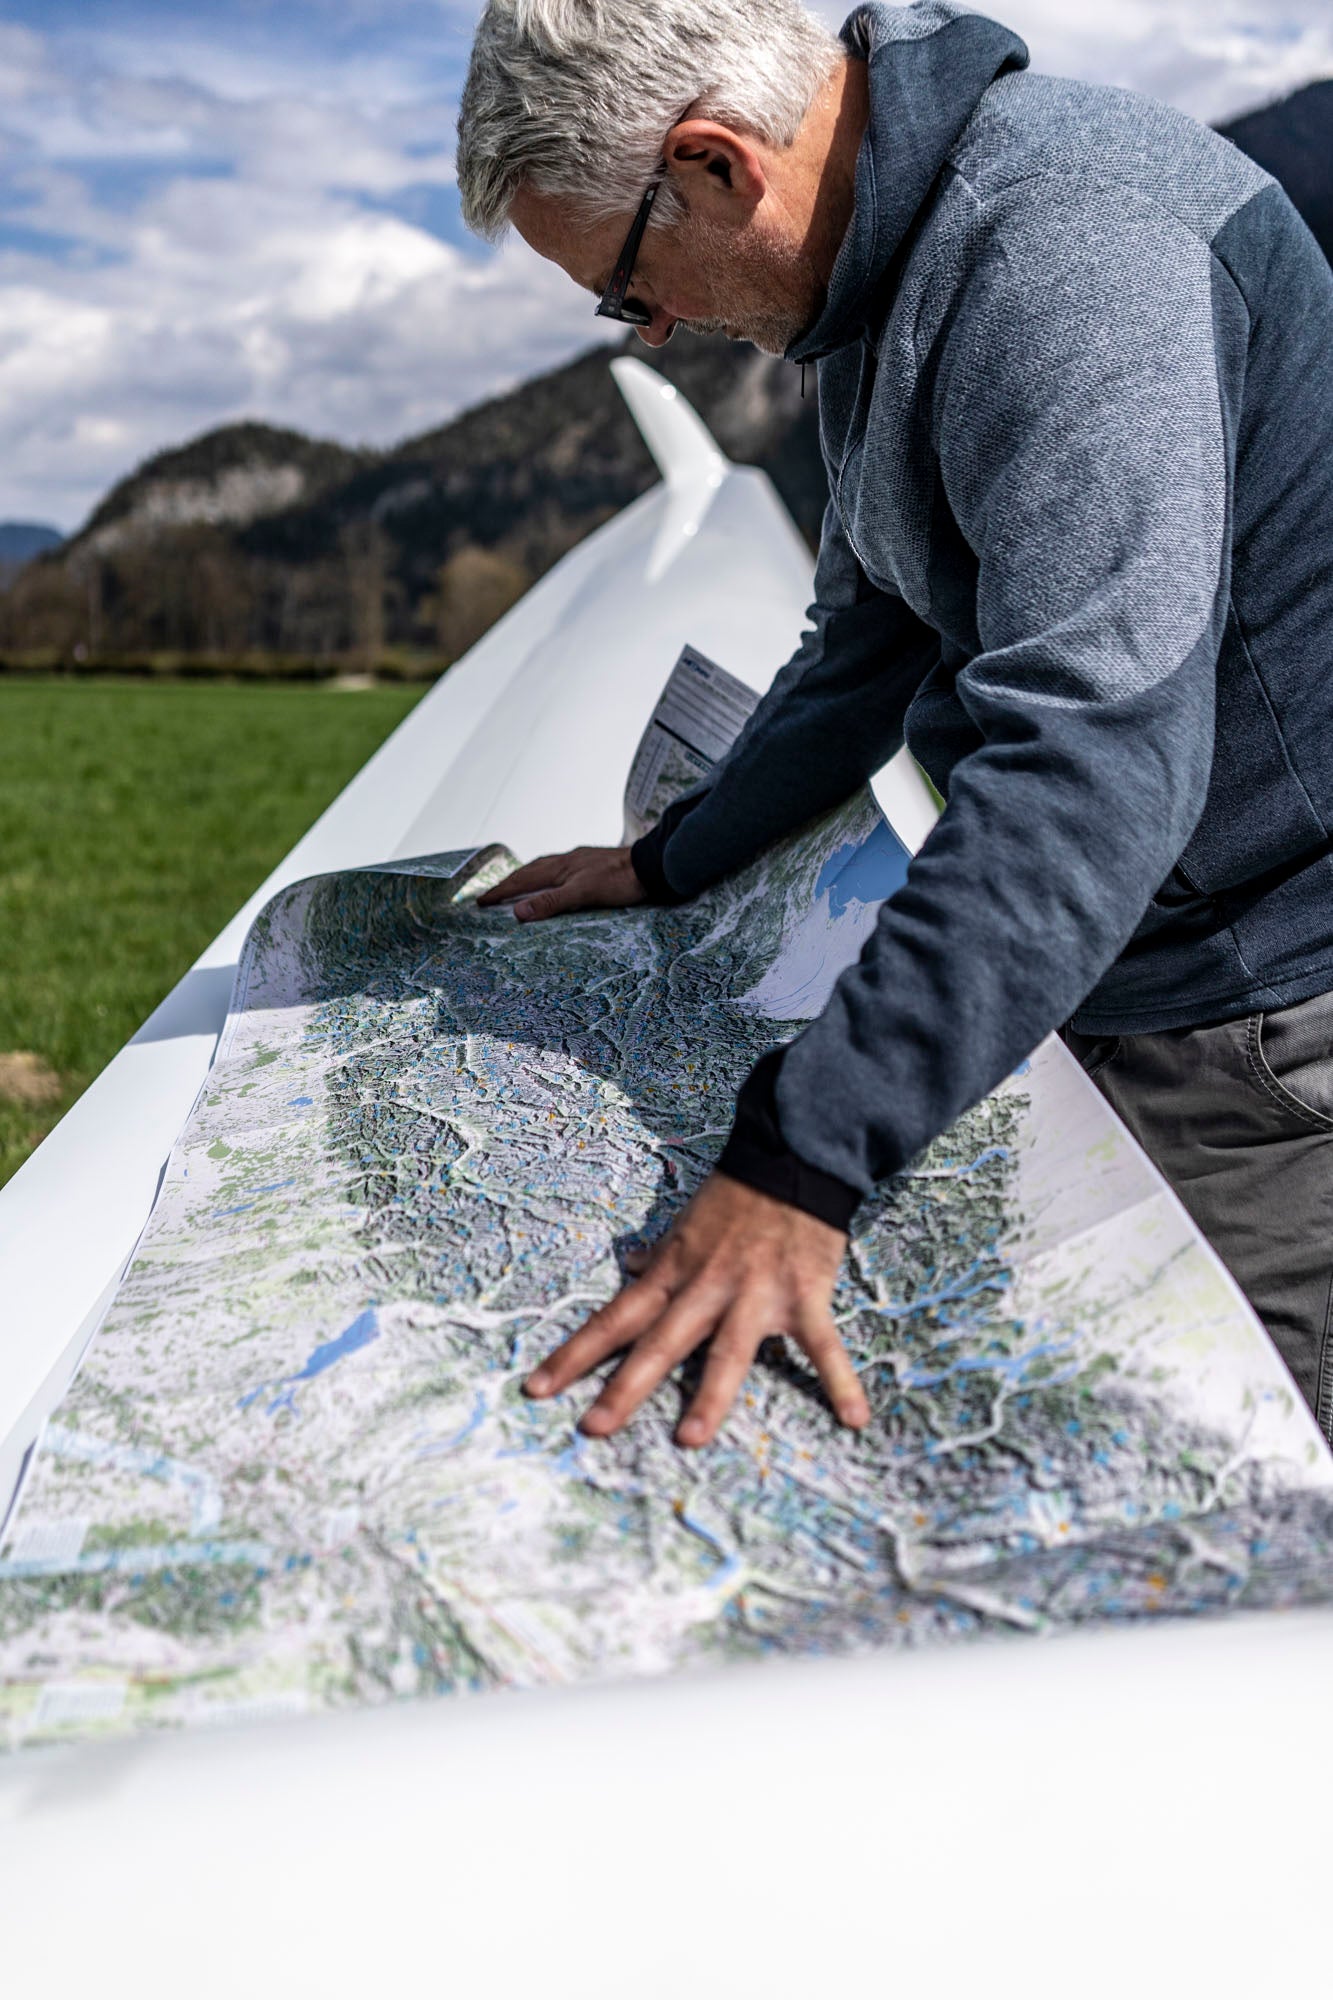
Valley wind, thermal and foehn maps of the Eastern Alps
Our VIENTO flight maps are a joint project by Werner Luidolt and Simon Lemmerer. Both are enthusiastic aviation enthusiasts and have set themselves the goal of passing on their shared knowledge to other aviation enthusiasts. The goal is to give something back to the aviation community and to make it easier for inexperienced pilots to get started with cross-country flying and, above all, Alpine flying .

Our cards
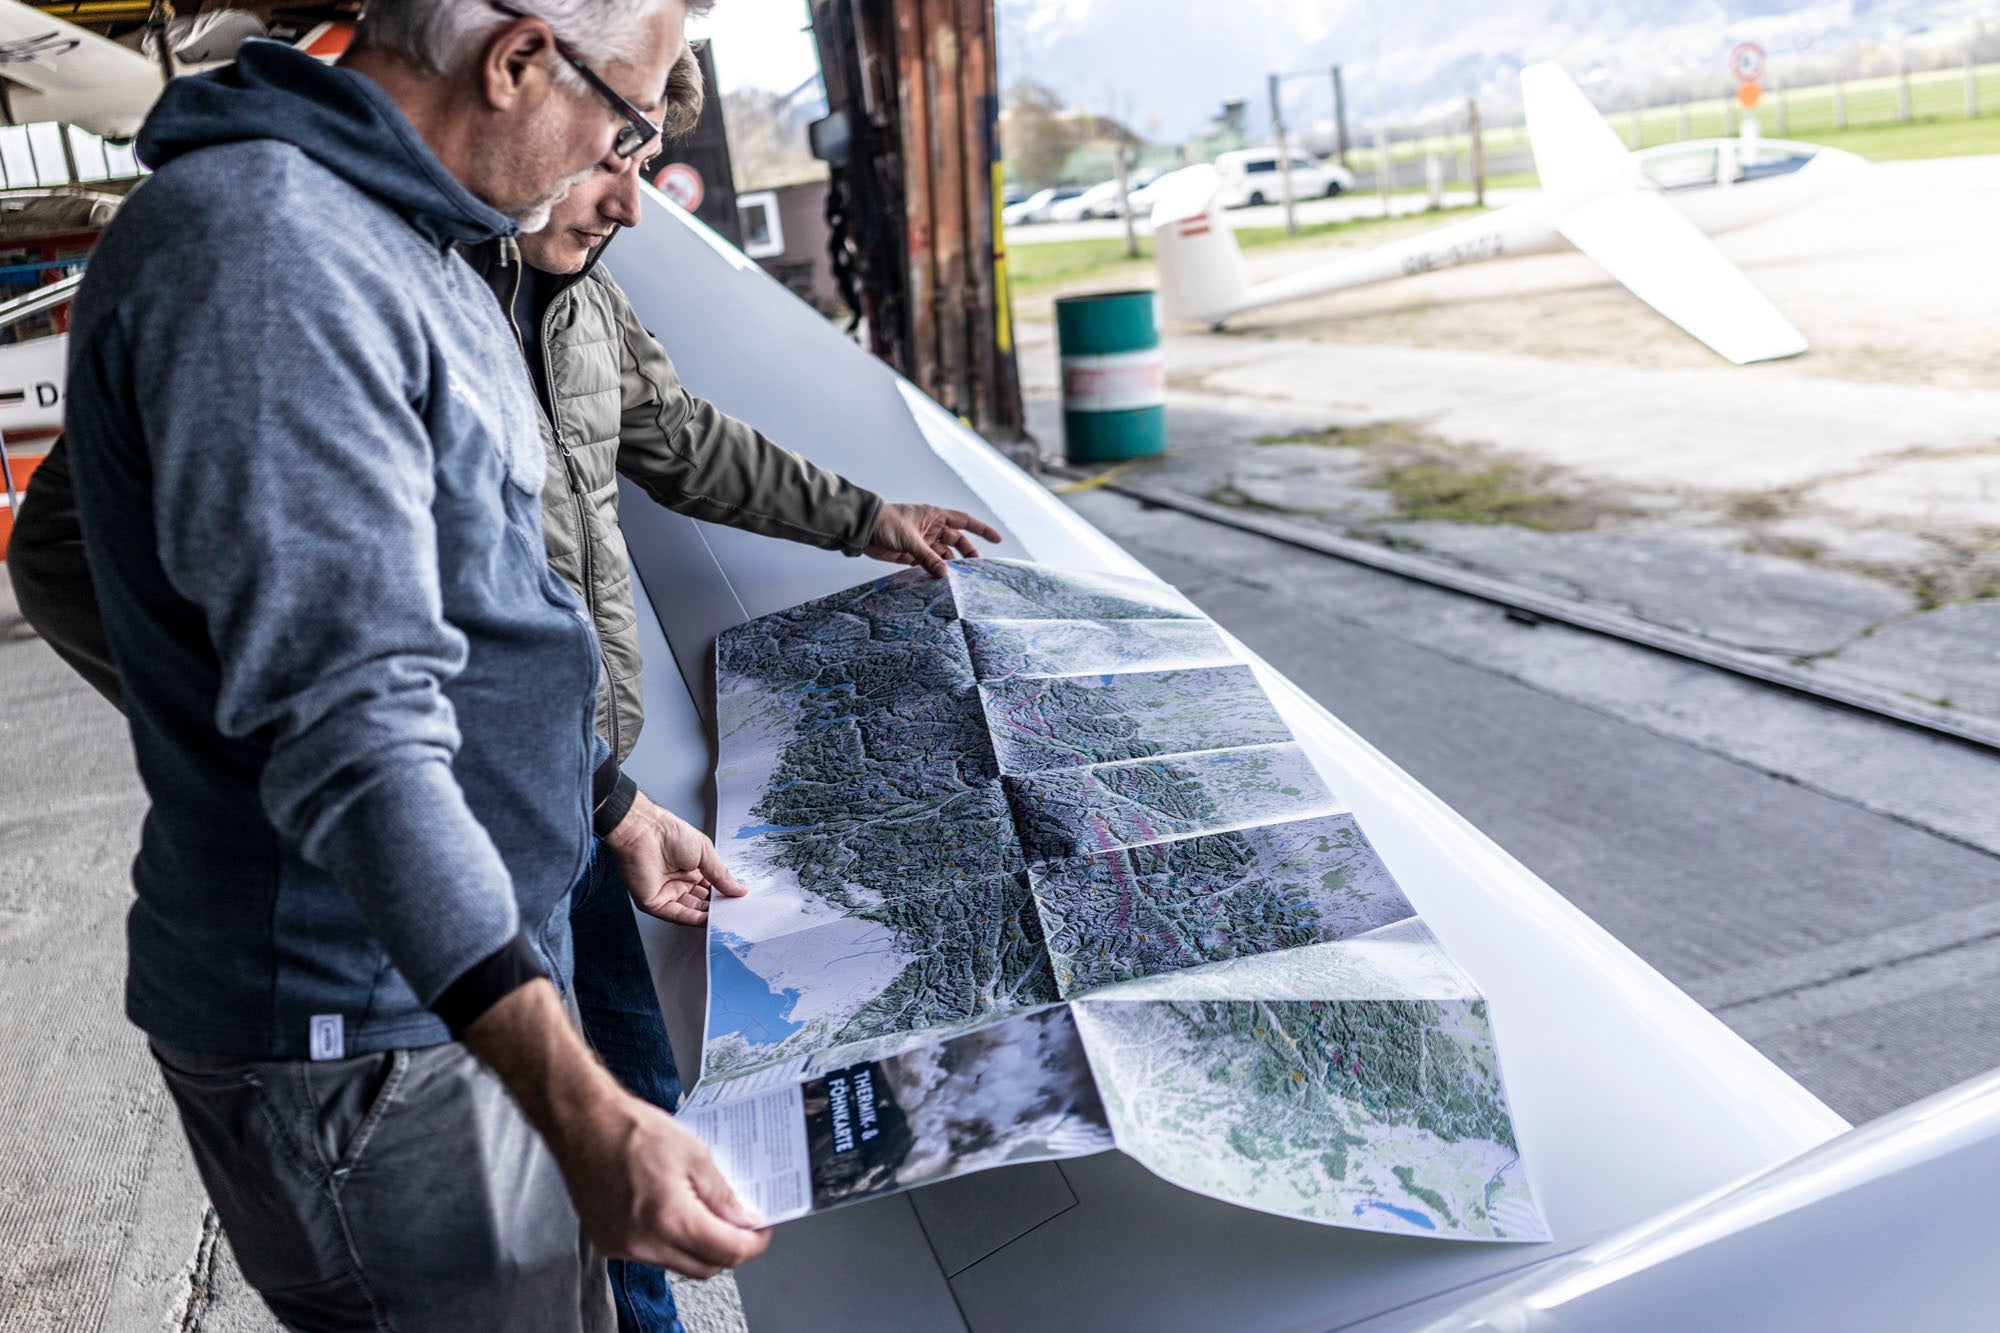
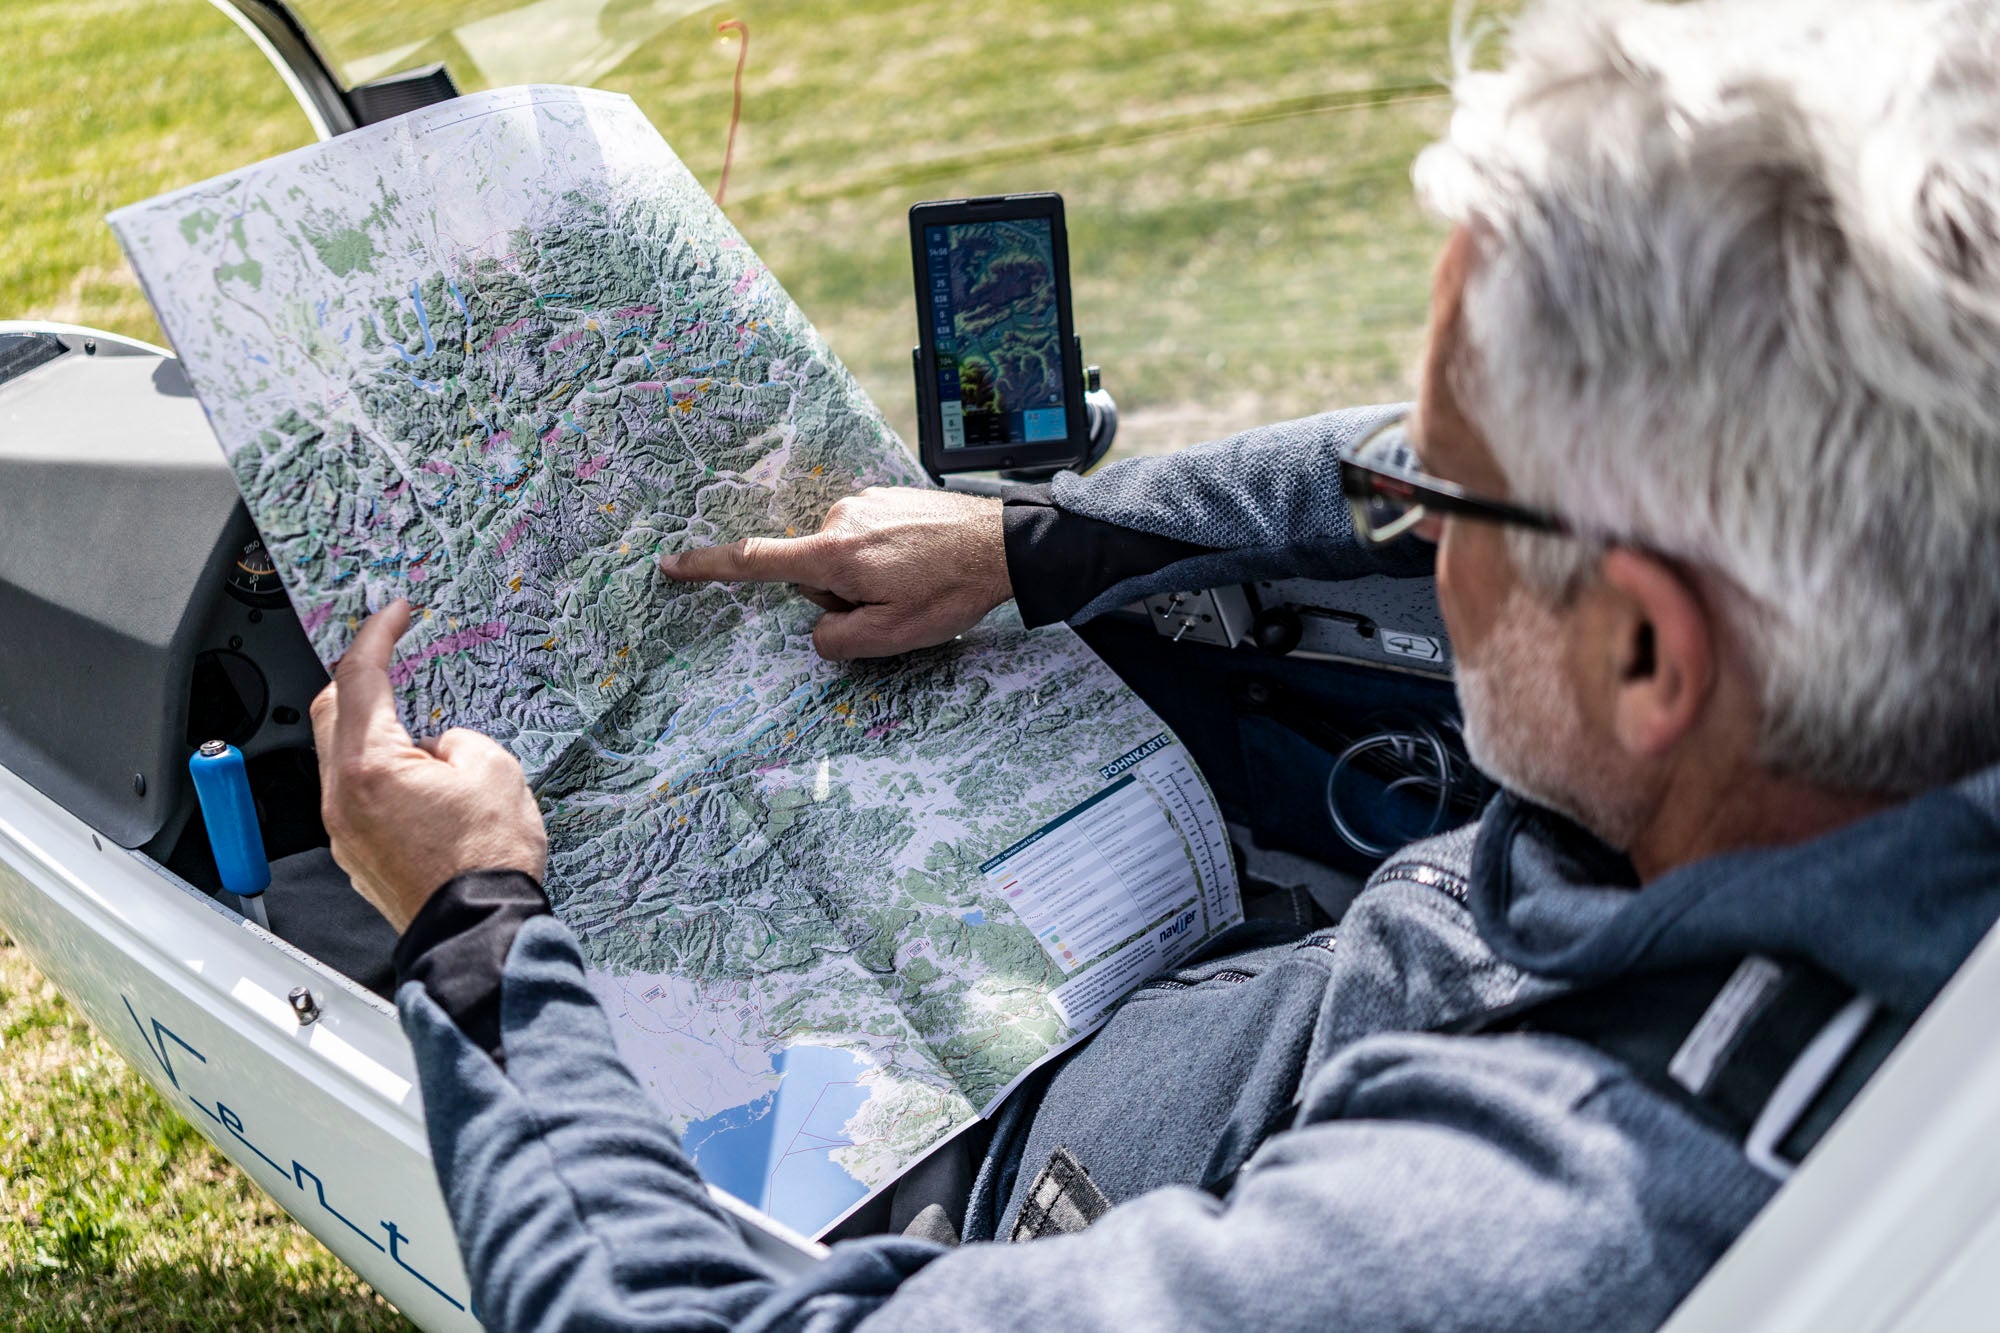
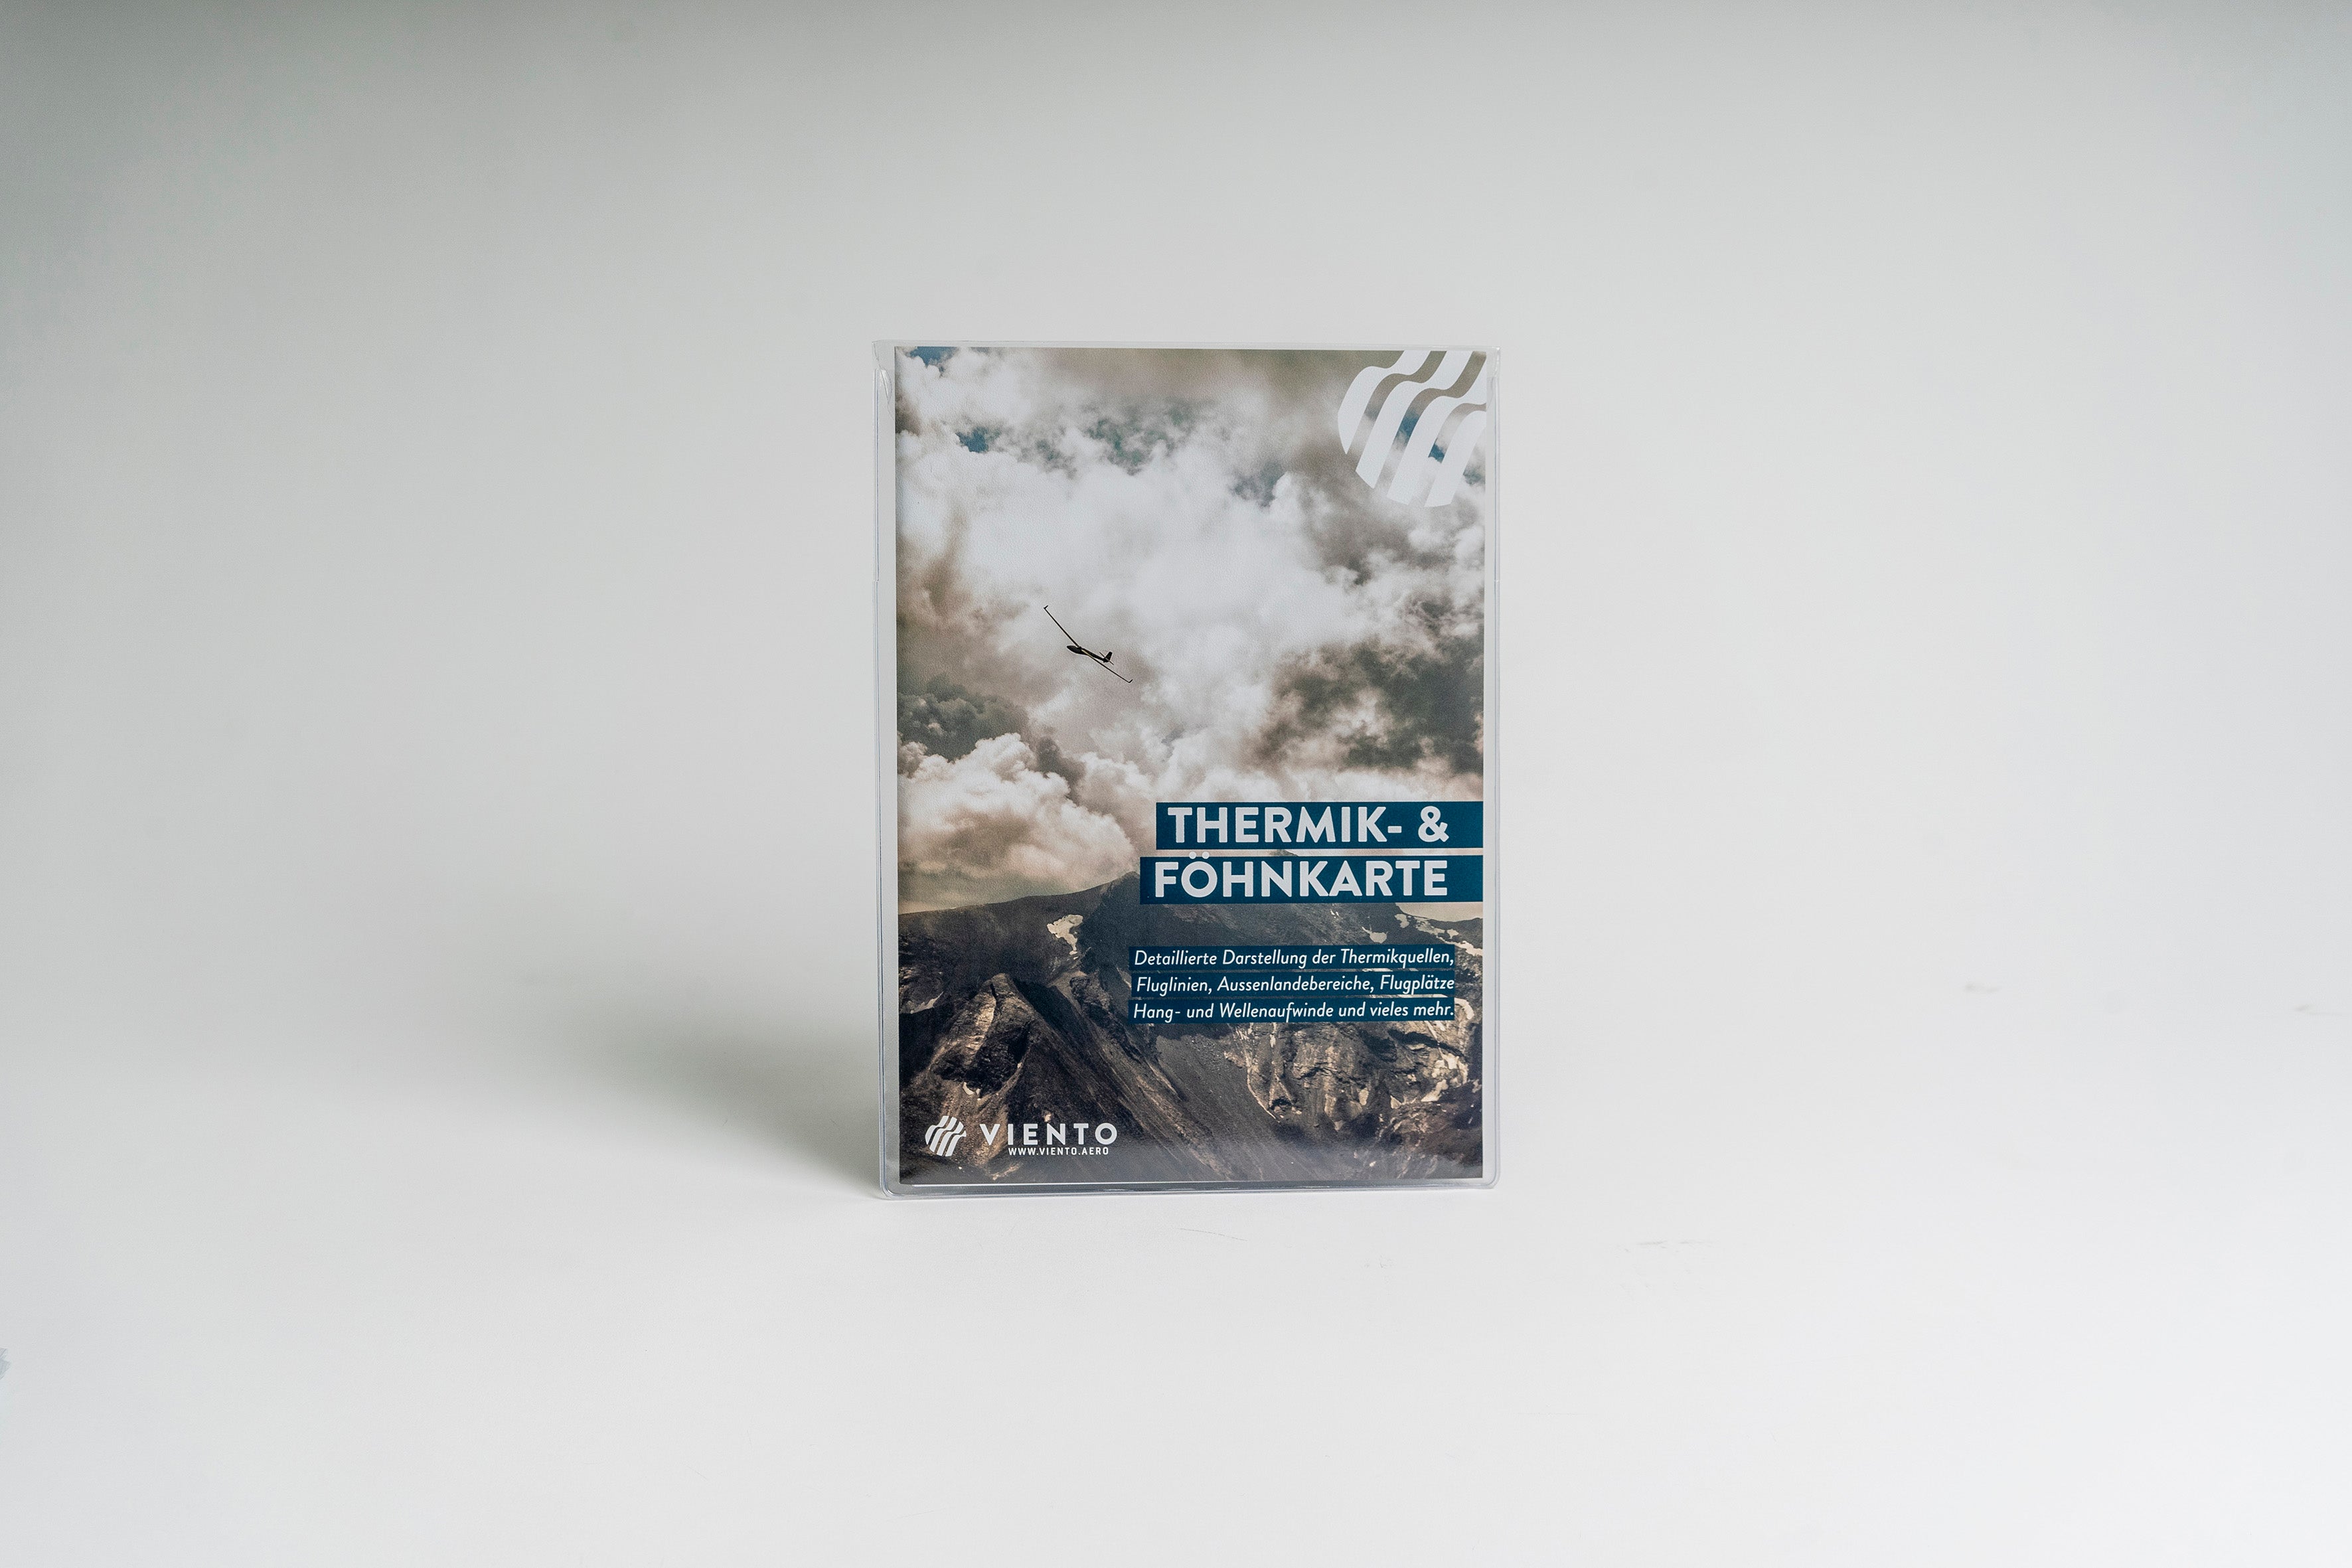


Foehn map (north and south foehn)
The Foehn map for north and south foehn winds is based on the collective experience of various pilots and our own knowledge. However, these special weather conditions require meticulous preparation and 100 percent control of the aircraft.
These maps serve as a tool to identify the larger context and sensitive areas and subsequently to understand independently what is happening in the weather system of the Alps. They are intended to provide the opportunity to learn to read the landscape and are primarily used to prepare for flights in the Eastern Alps.
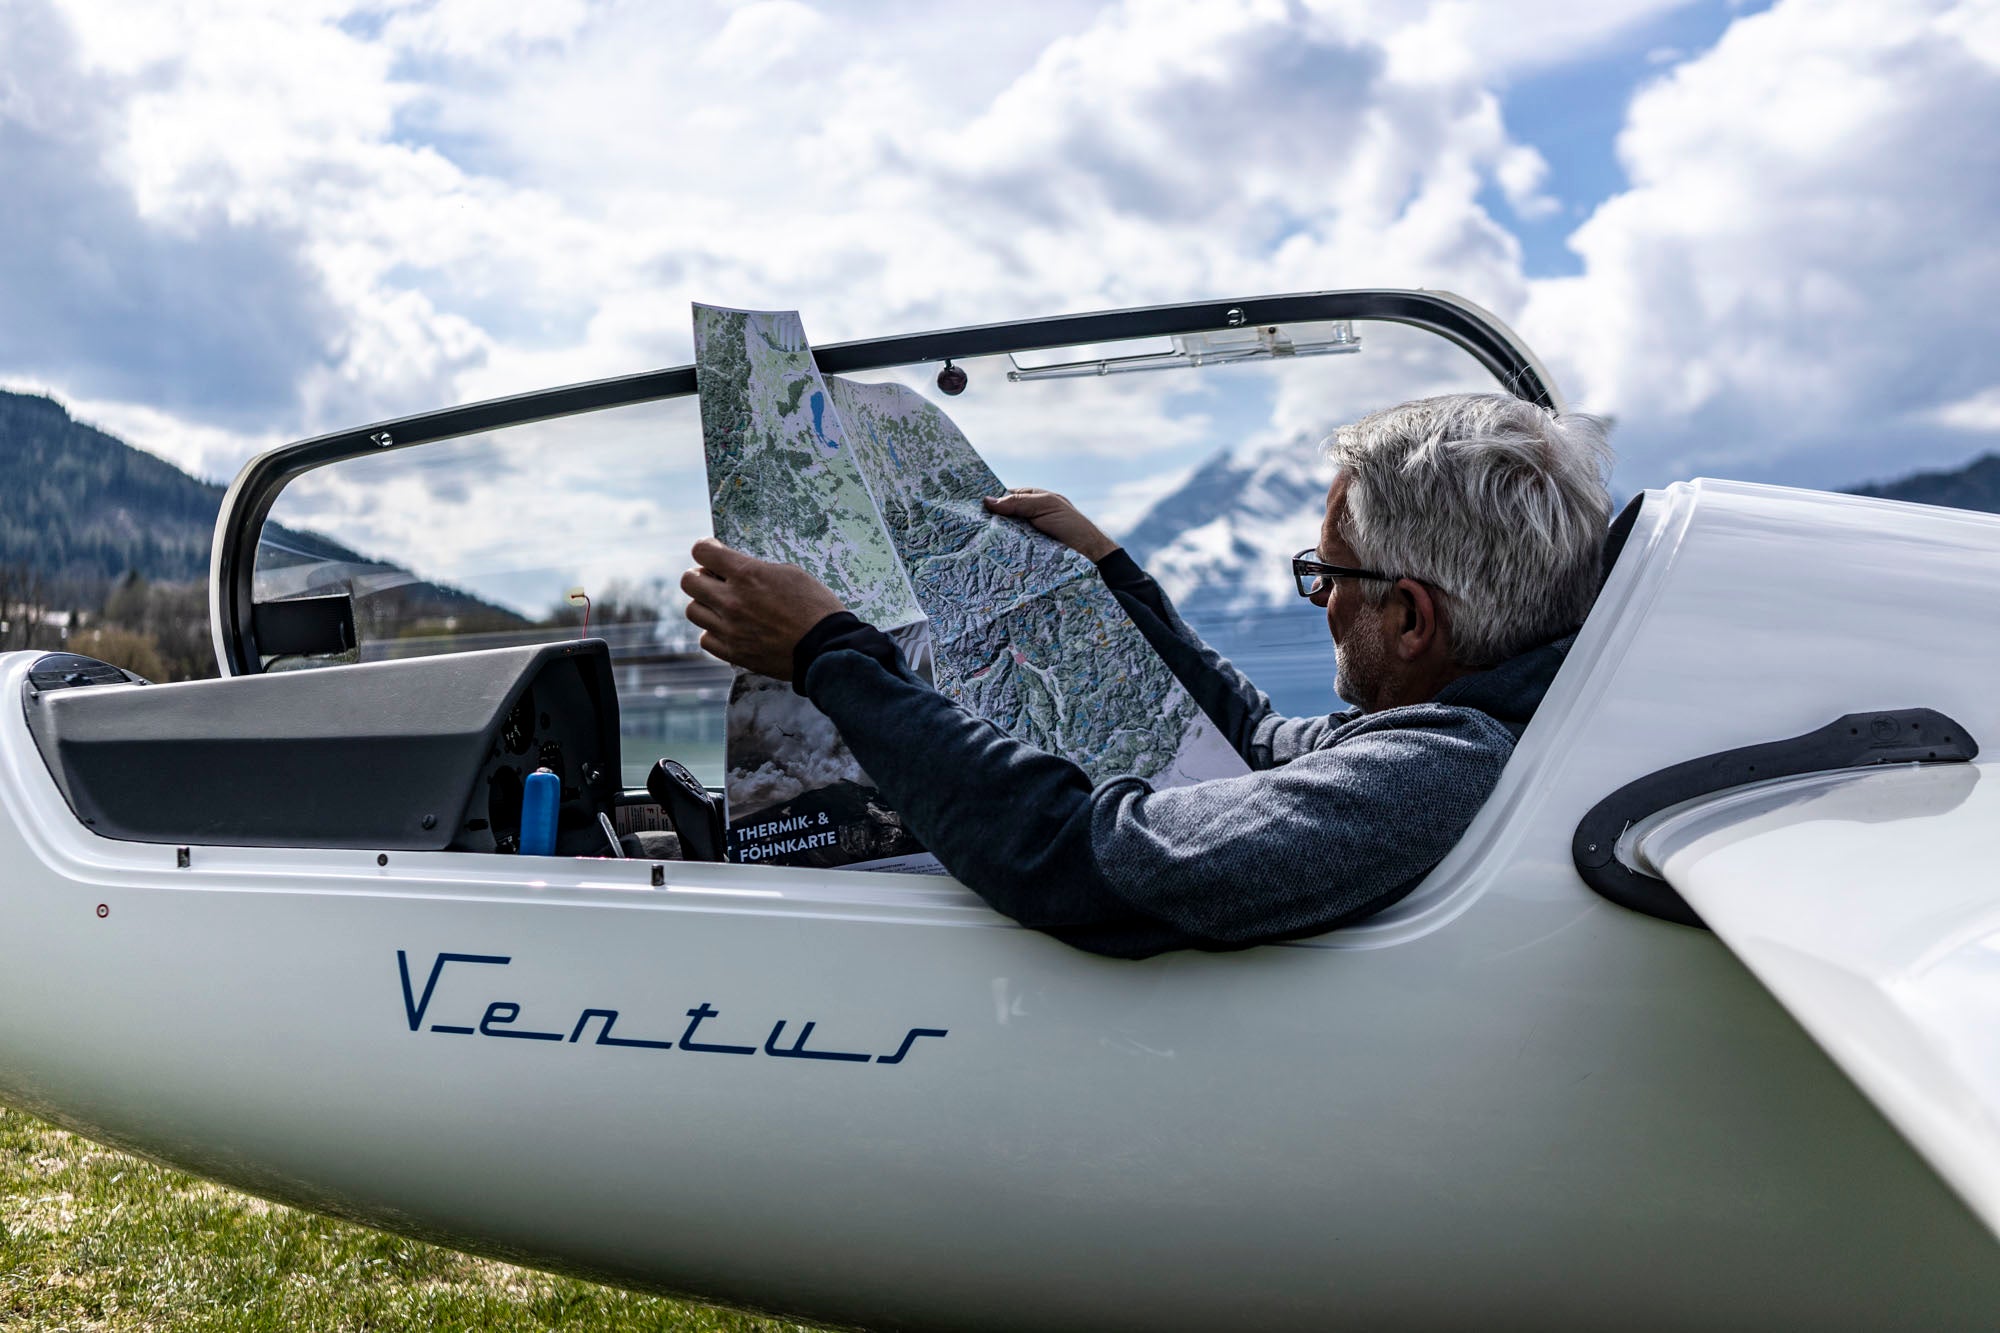
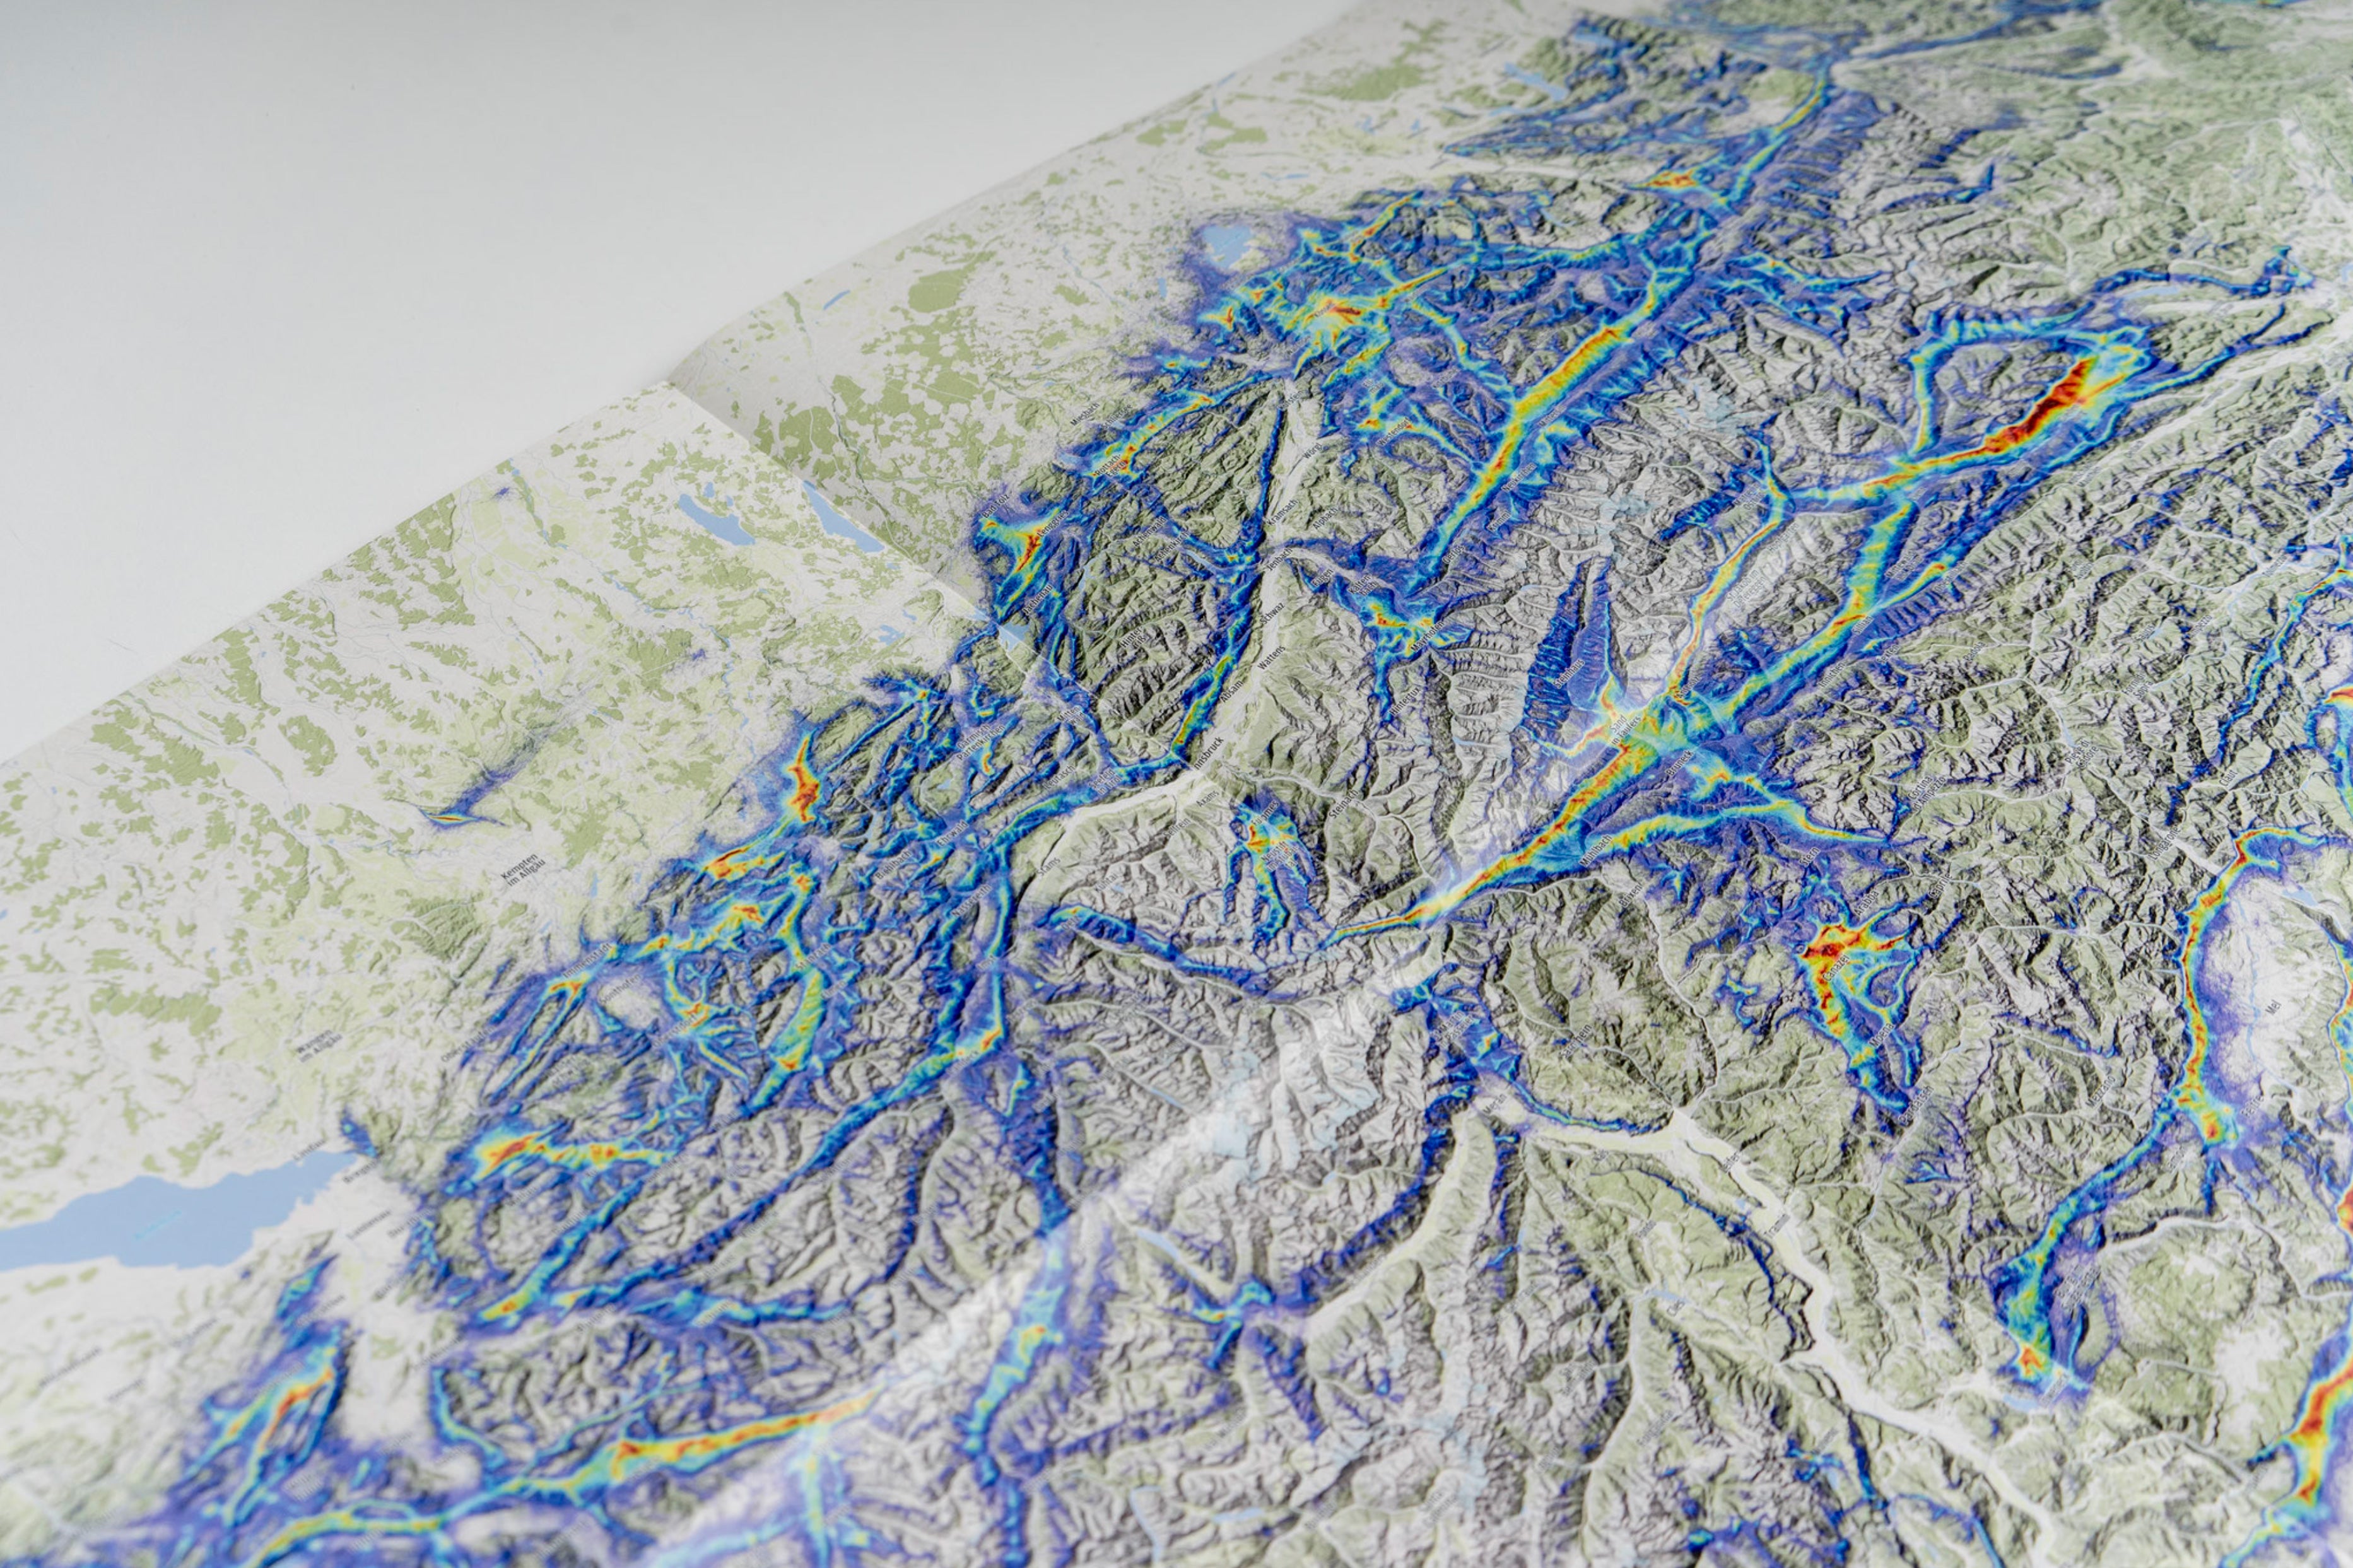
Thermal map
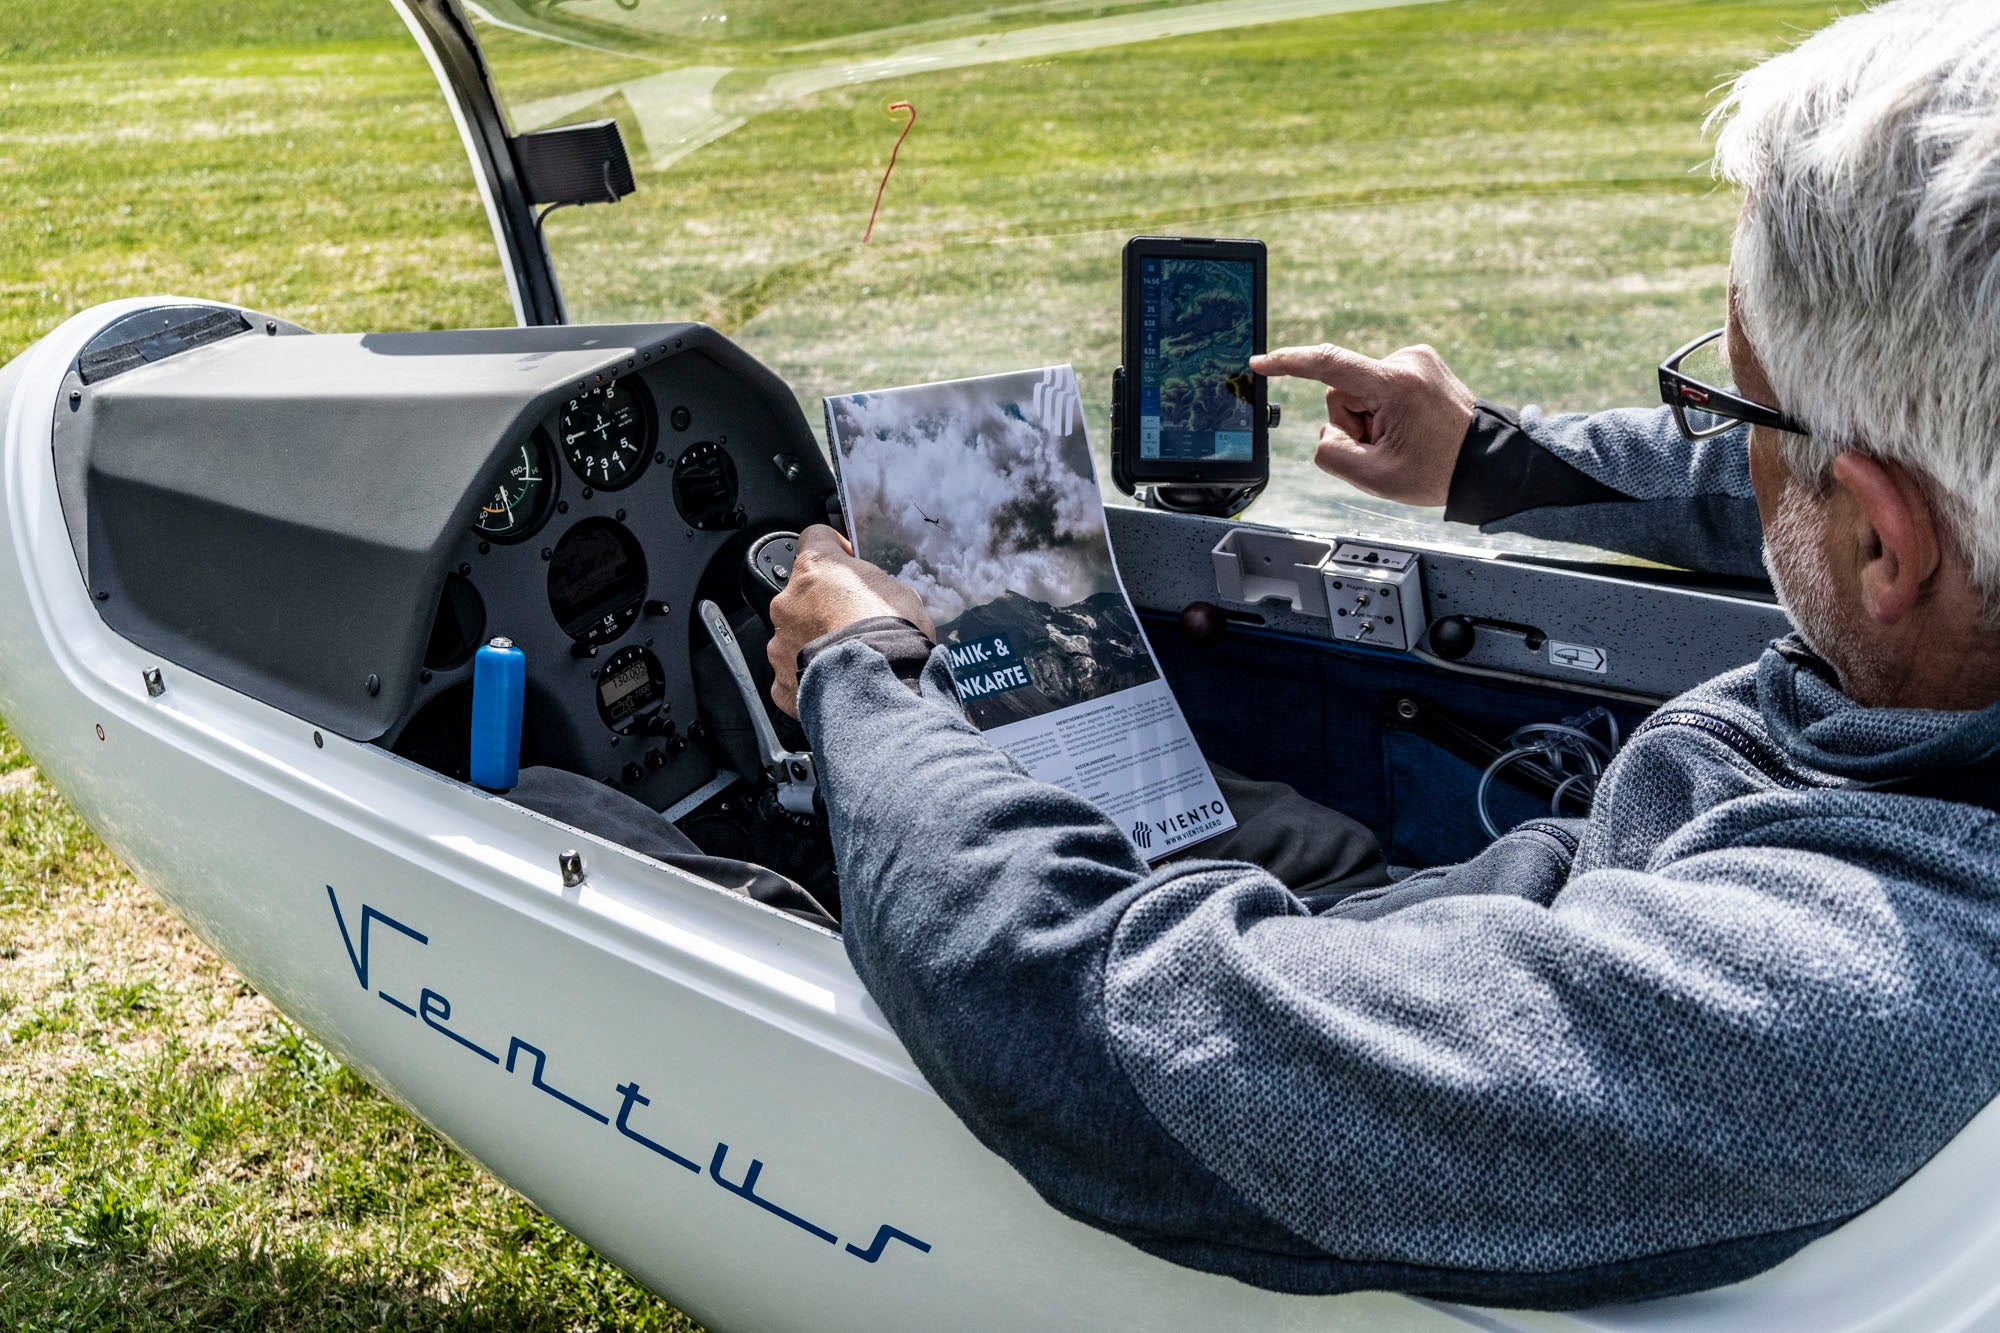
This map shows thermals, flight lines and landing options on a day with little wind and thermal activity. The fast flight lines here are optimized for gliding, but are relevant and useful for paragliders and hang gliders in some areas. The off-shore landing options for gliders are also an option for hang gliders, and all thermals are of course valid for all thermal pilots. The majority of the map was created using Werner and Simon's many years of experience , expanded with the knowledge of locals, and worked out and optimized over a long period of time. All altitudes are given in MSL.
The thermals are all hotspots that have been flown to.
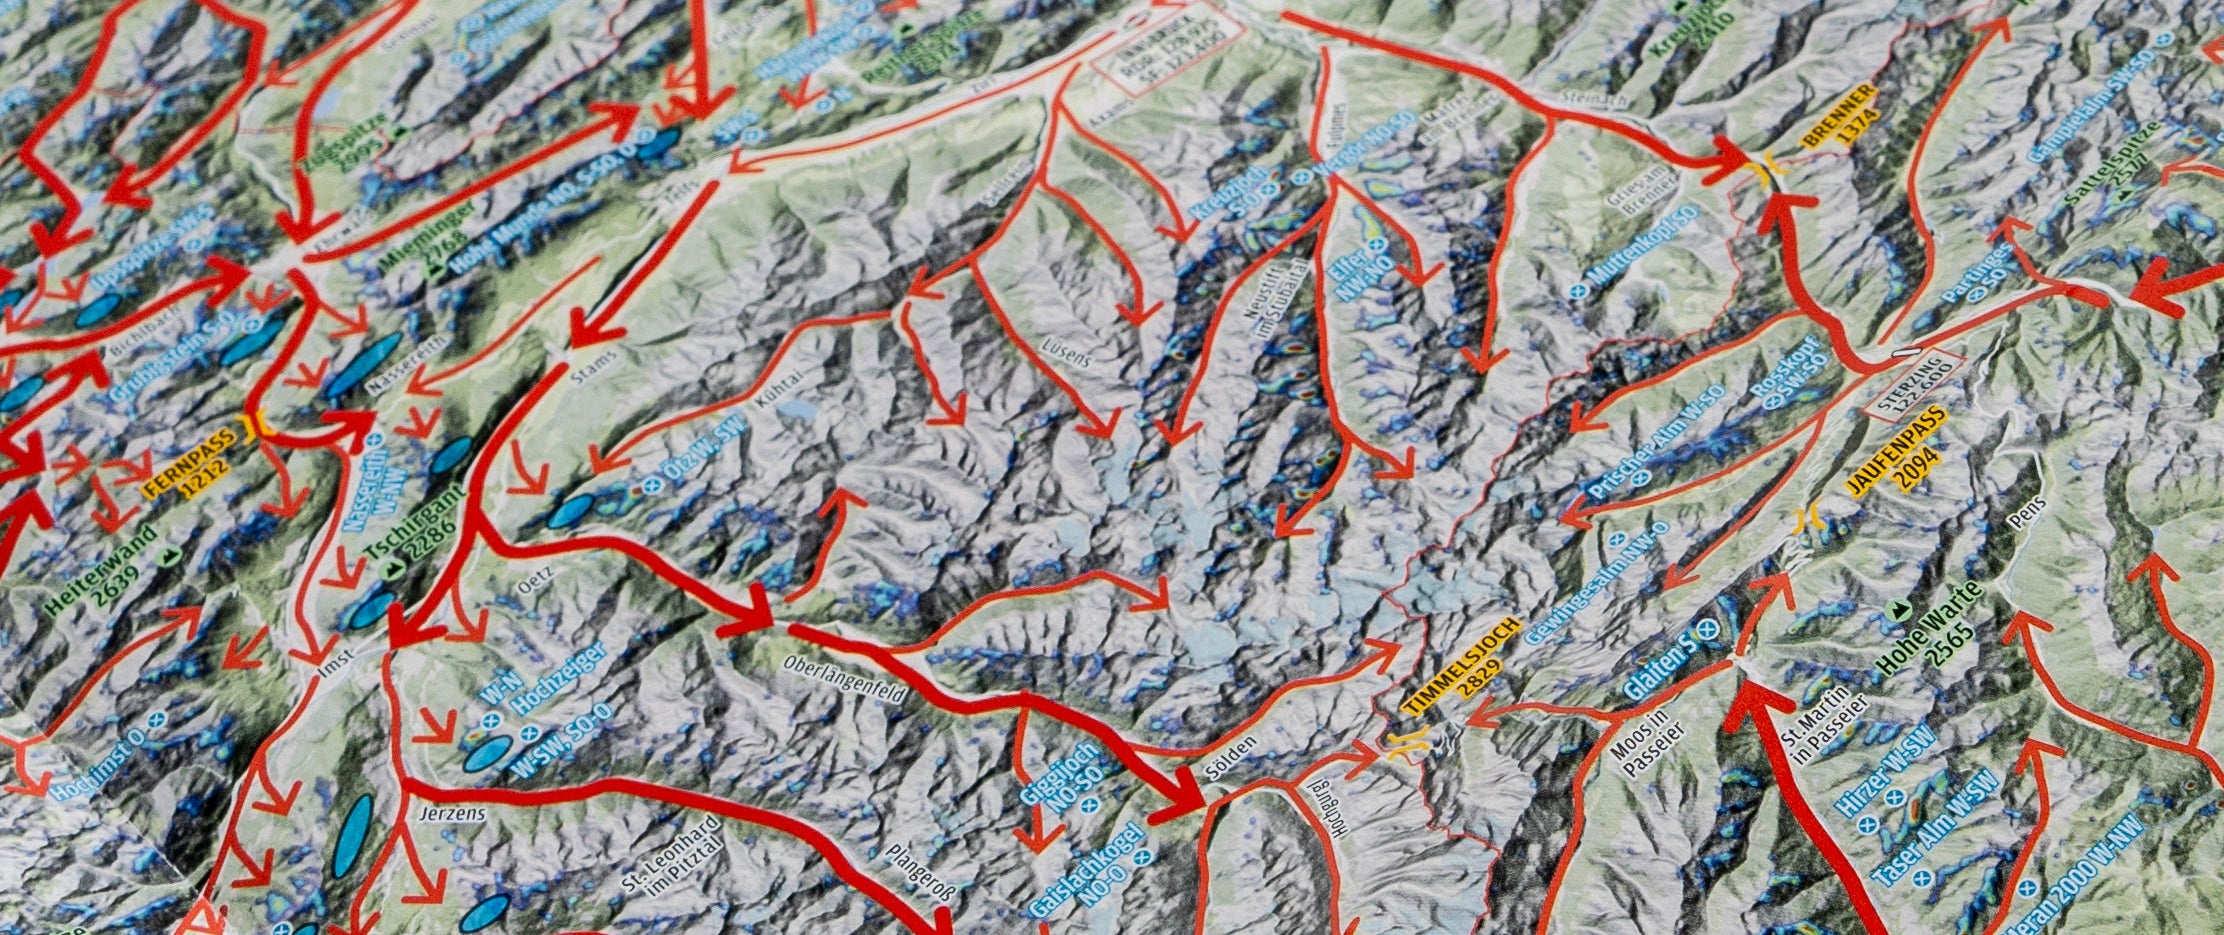
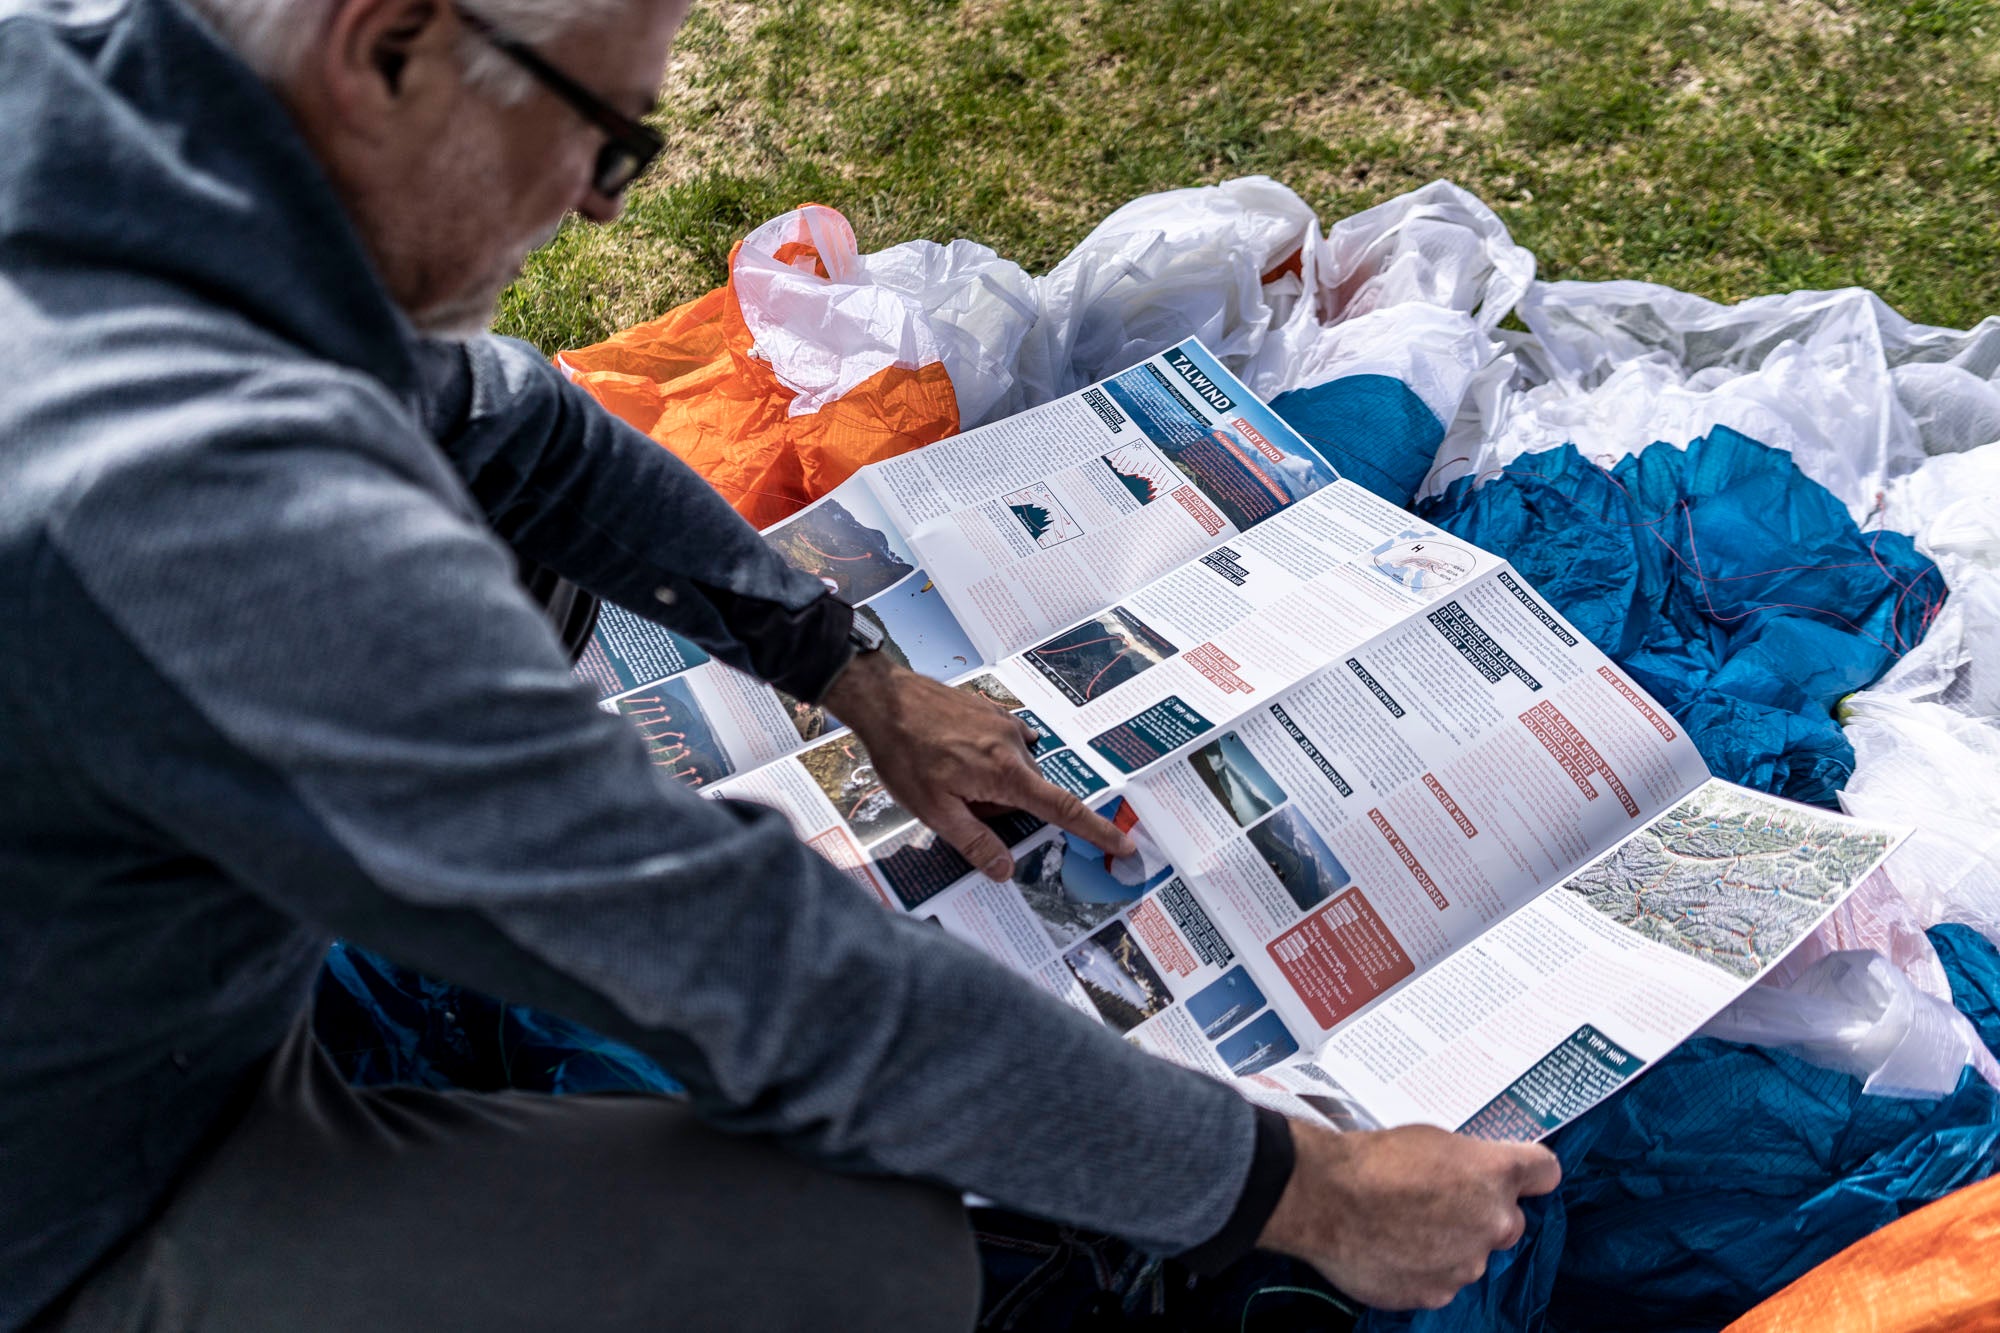
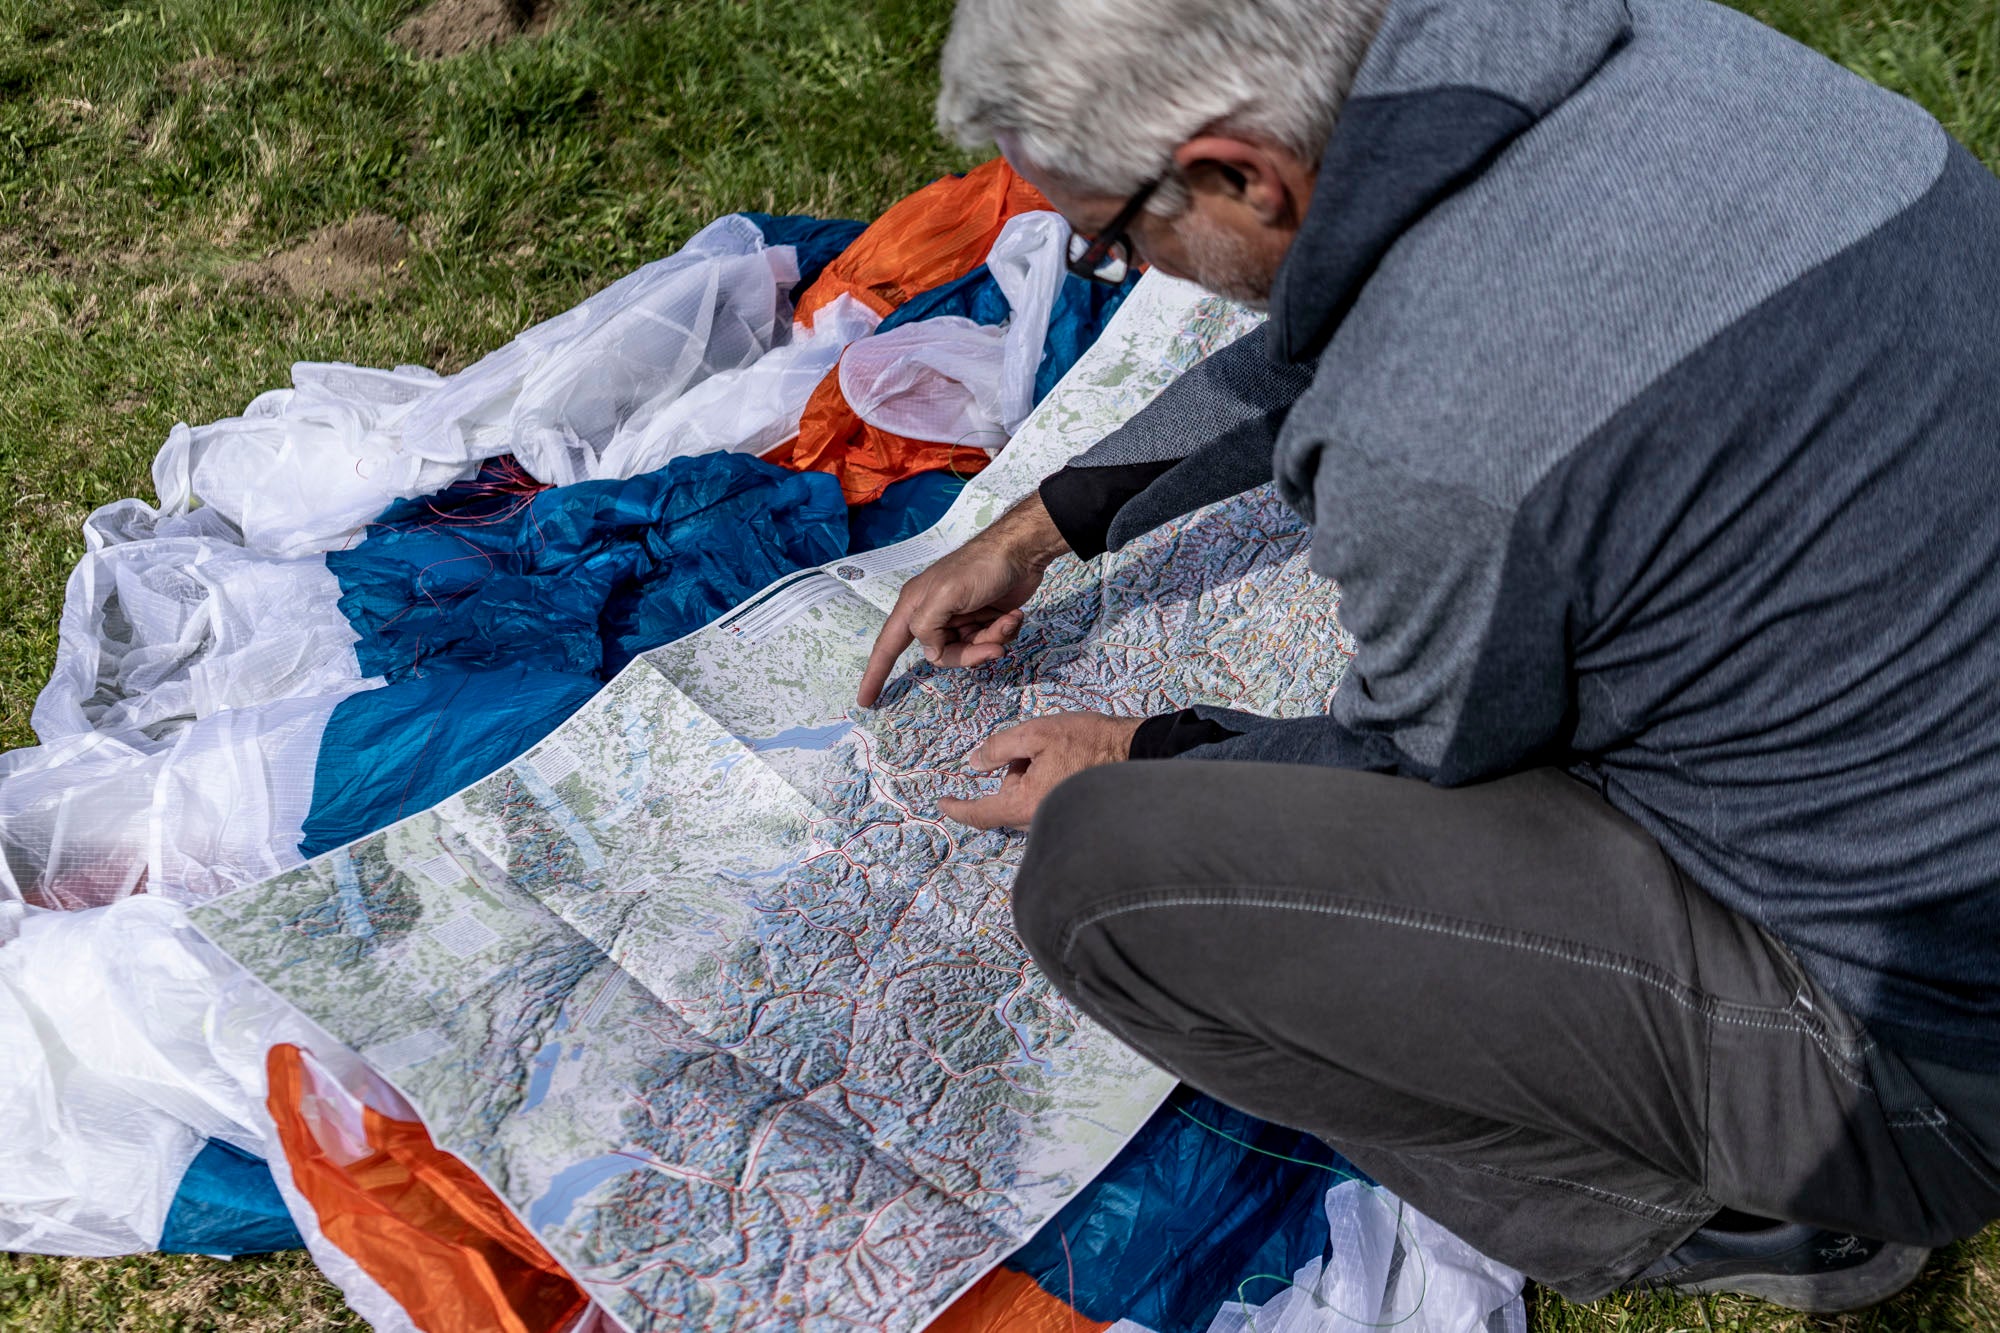
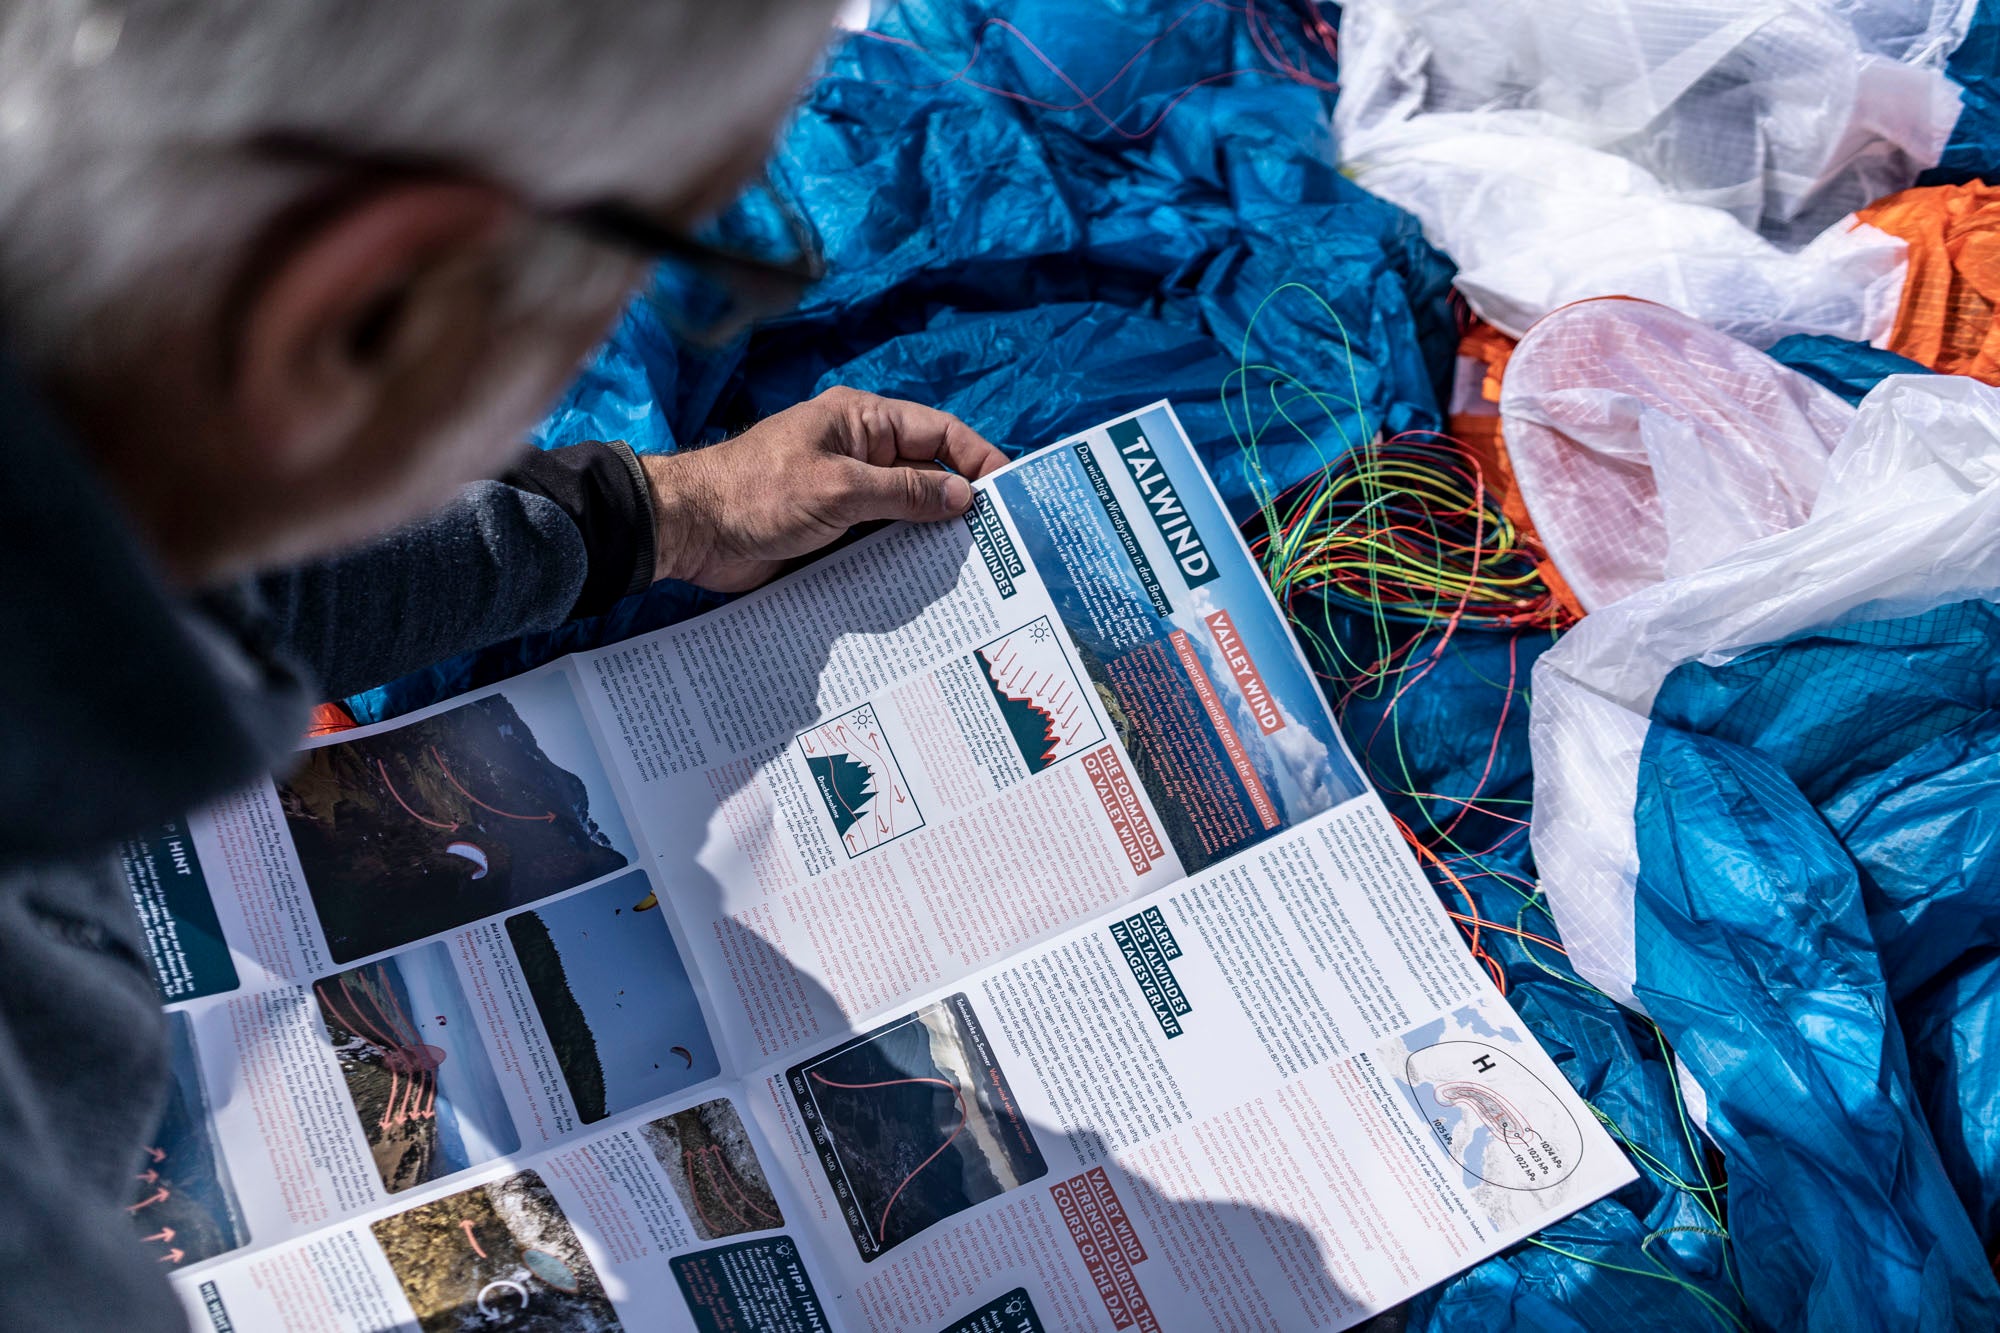
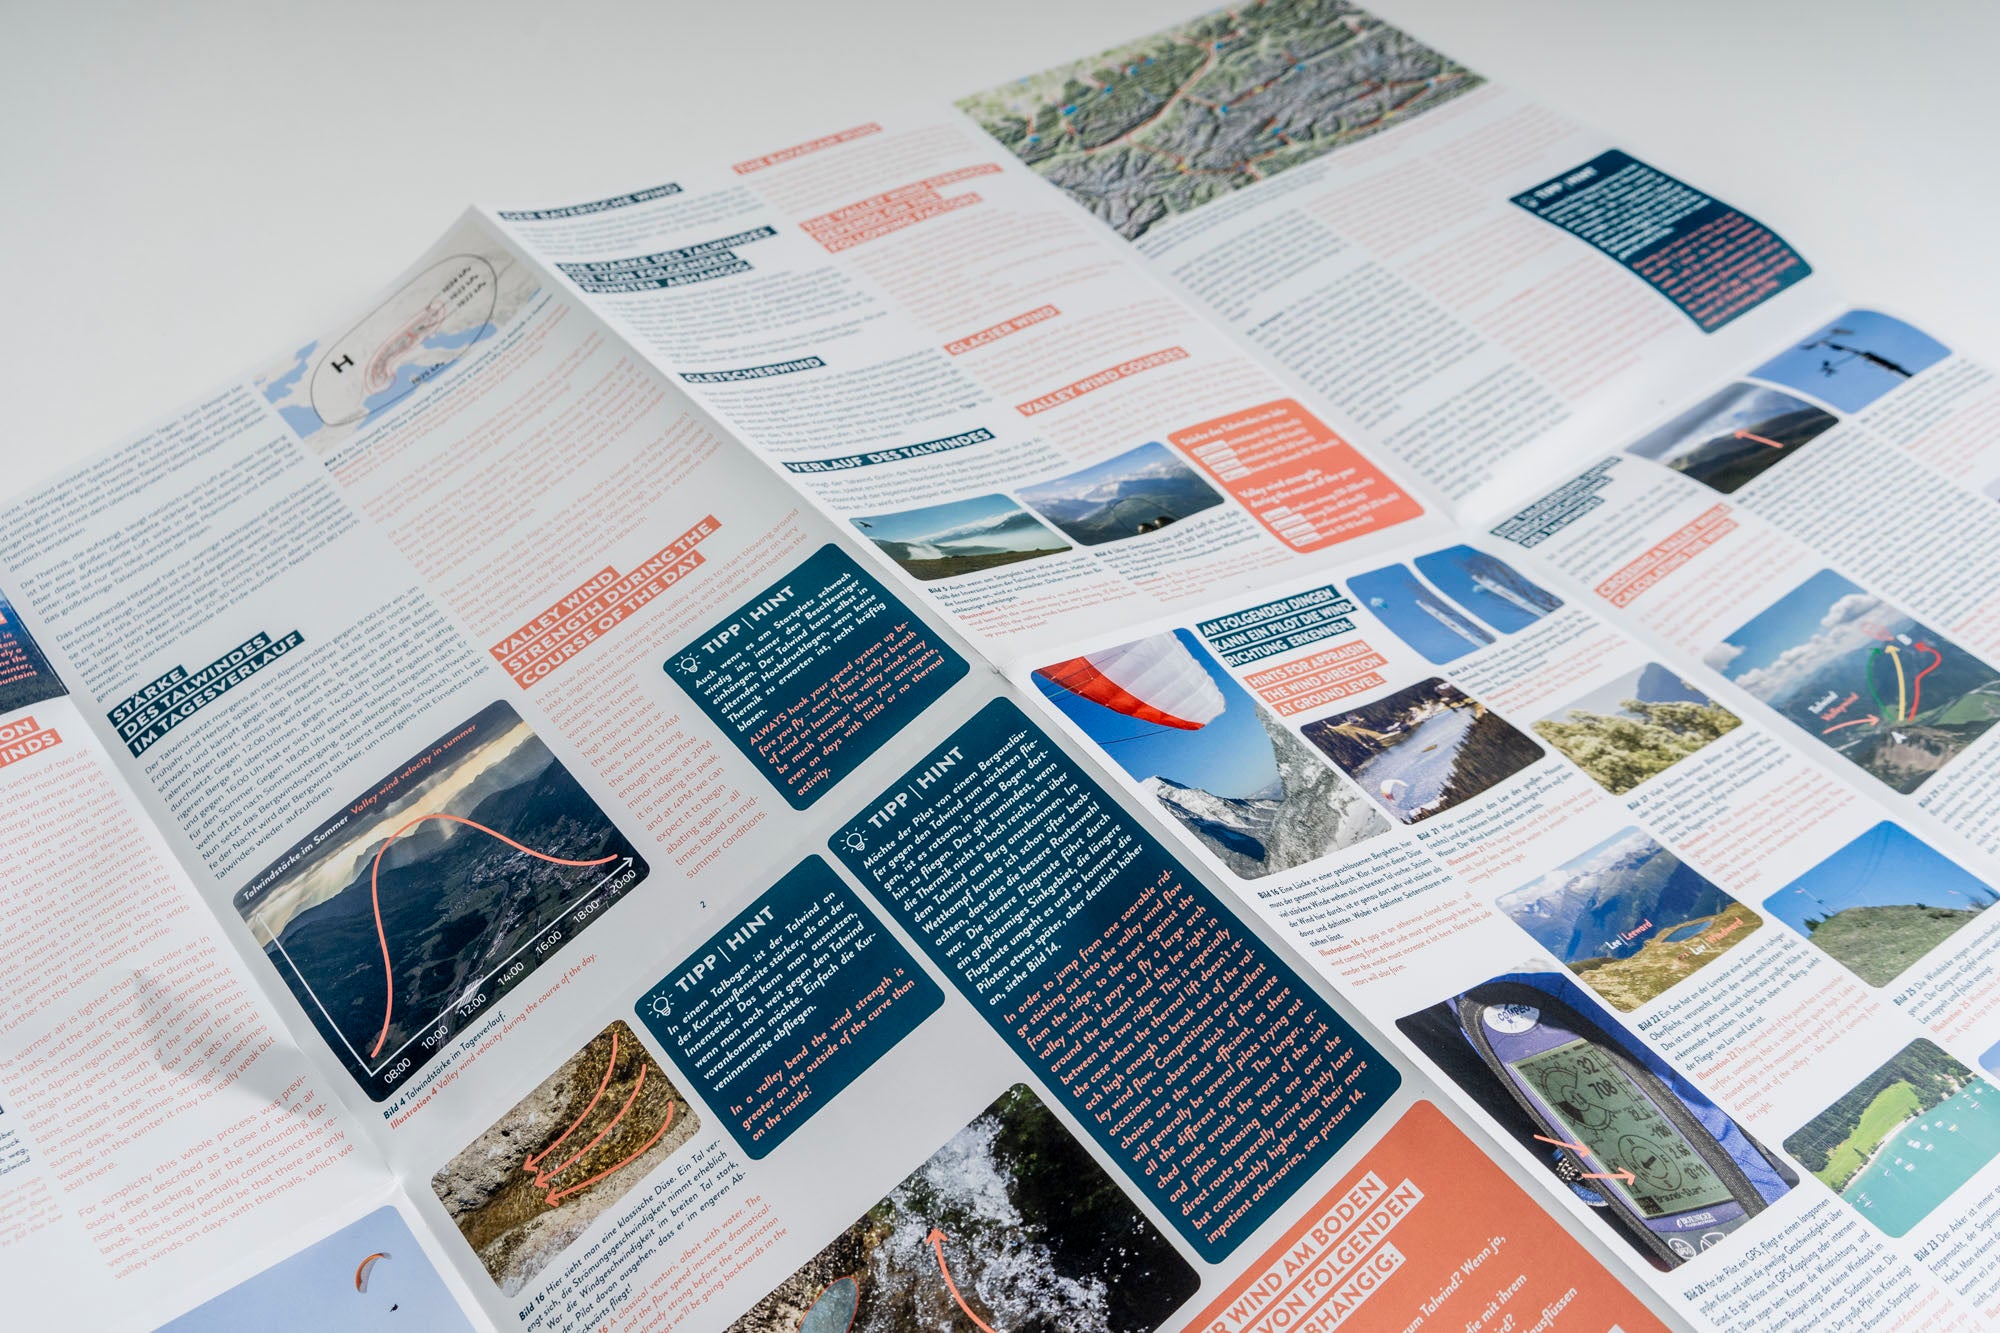
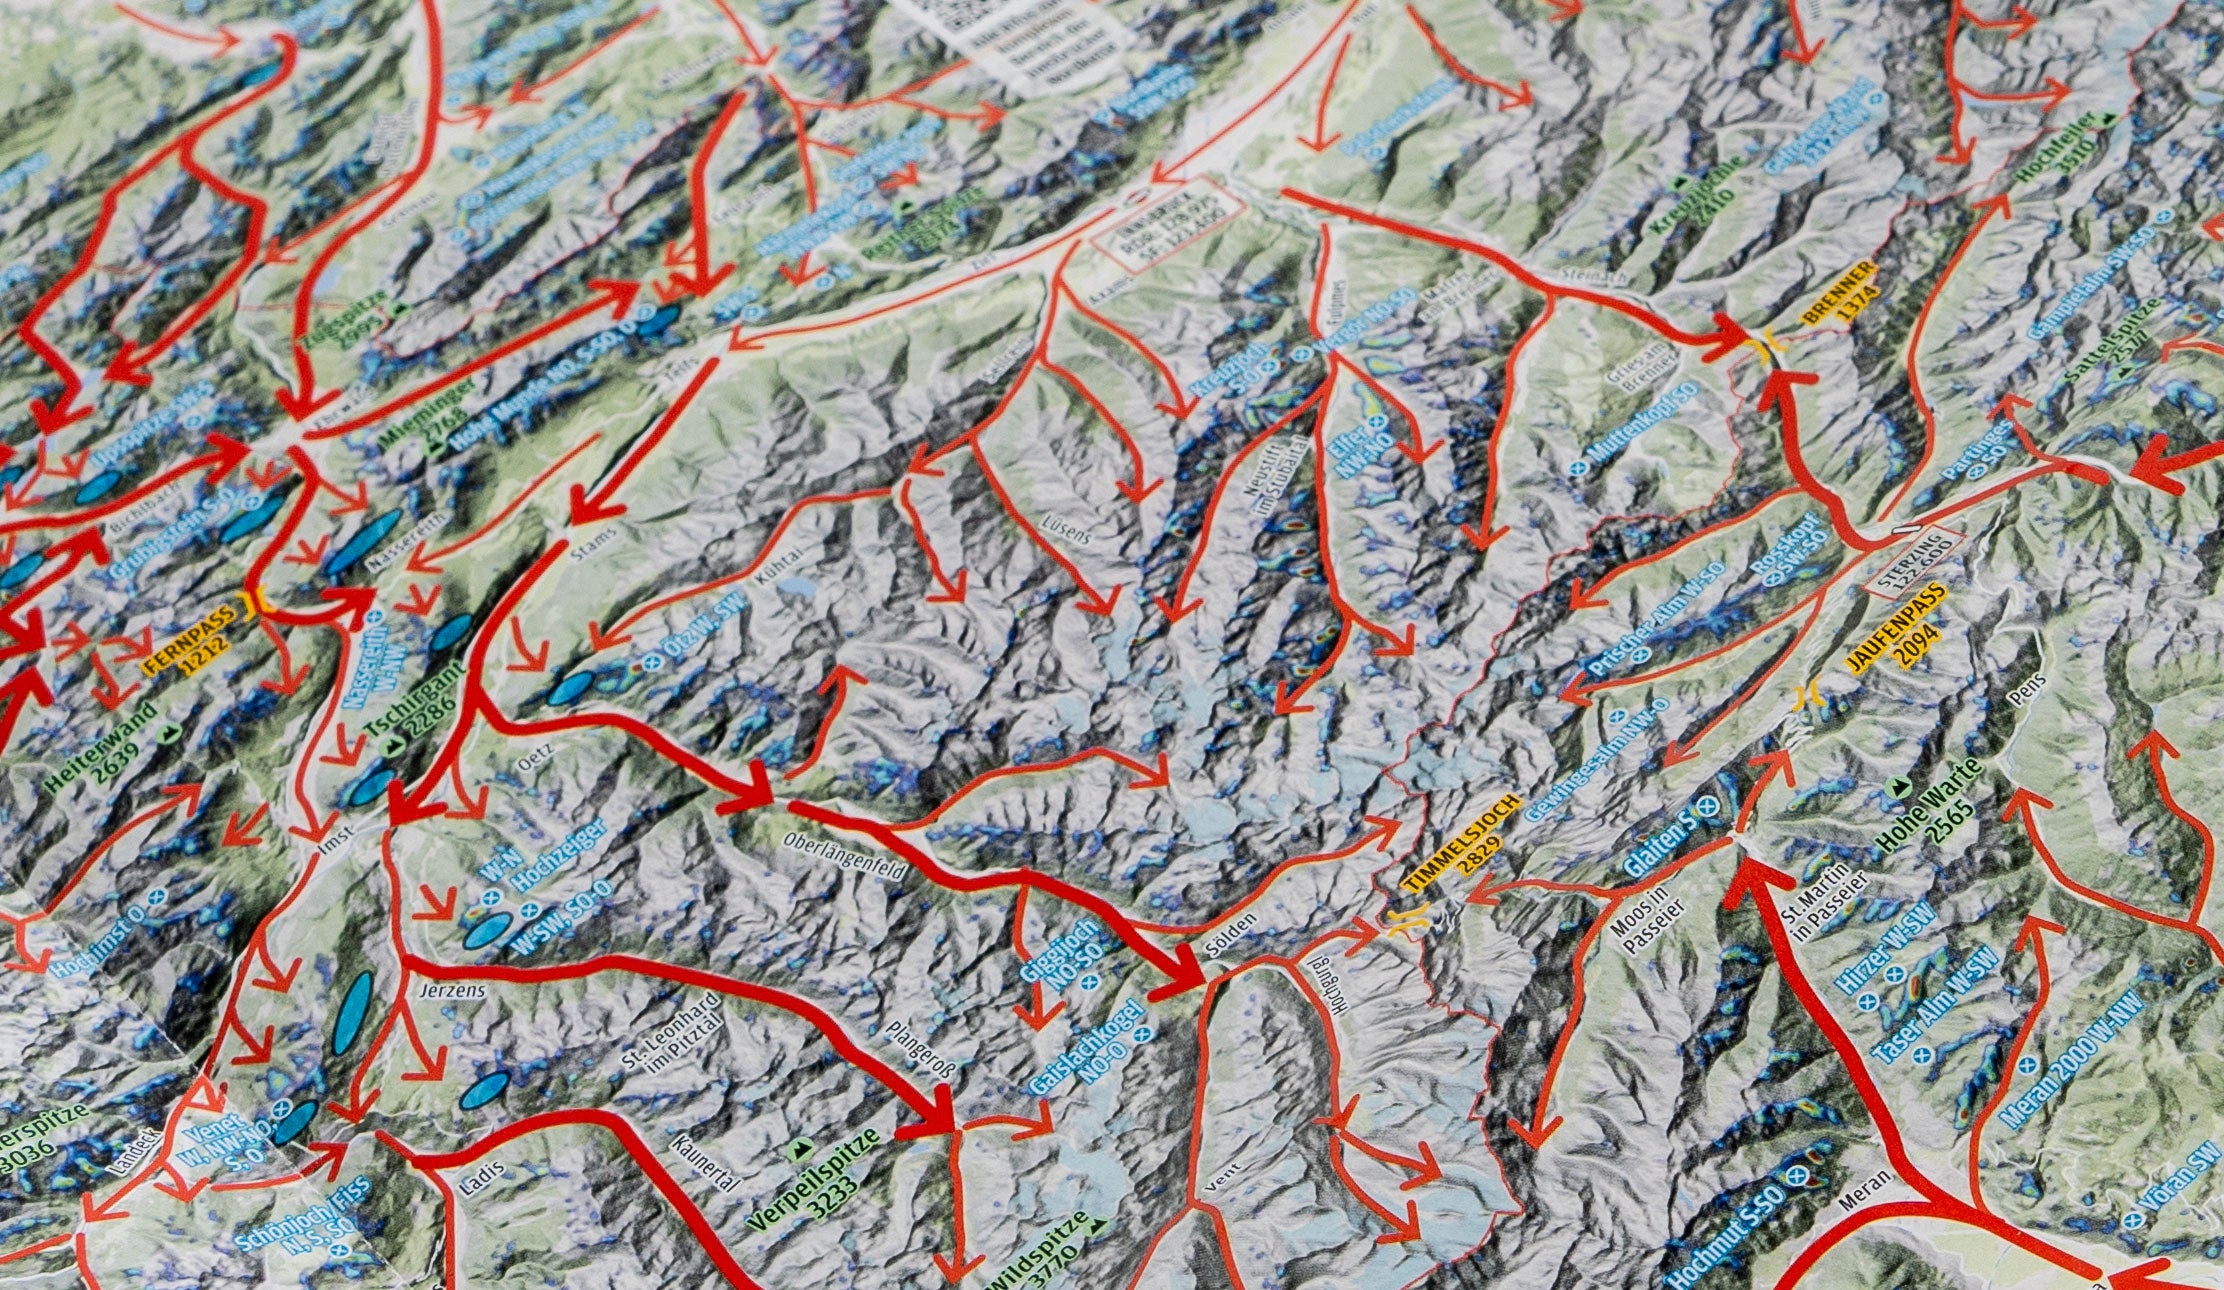
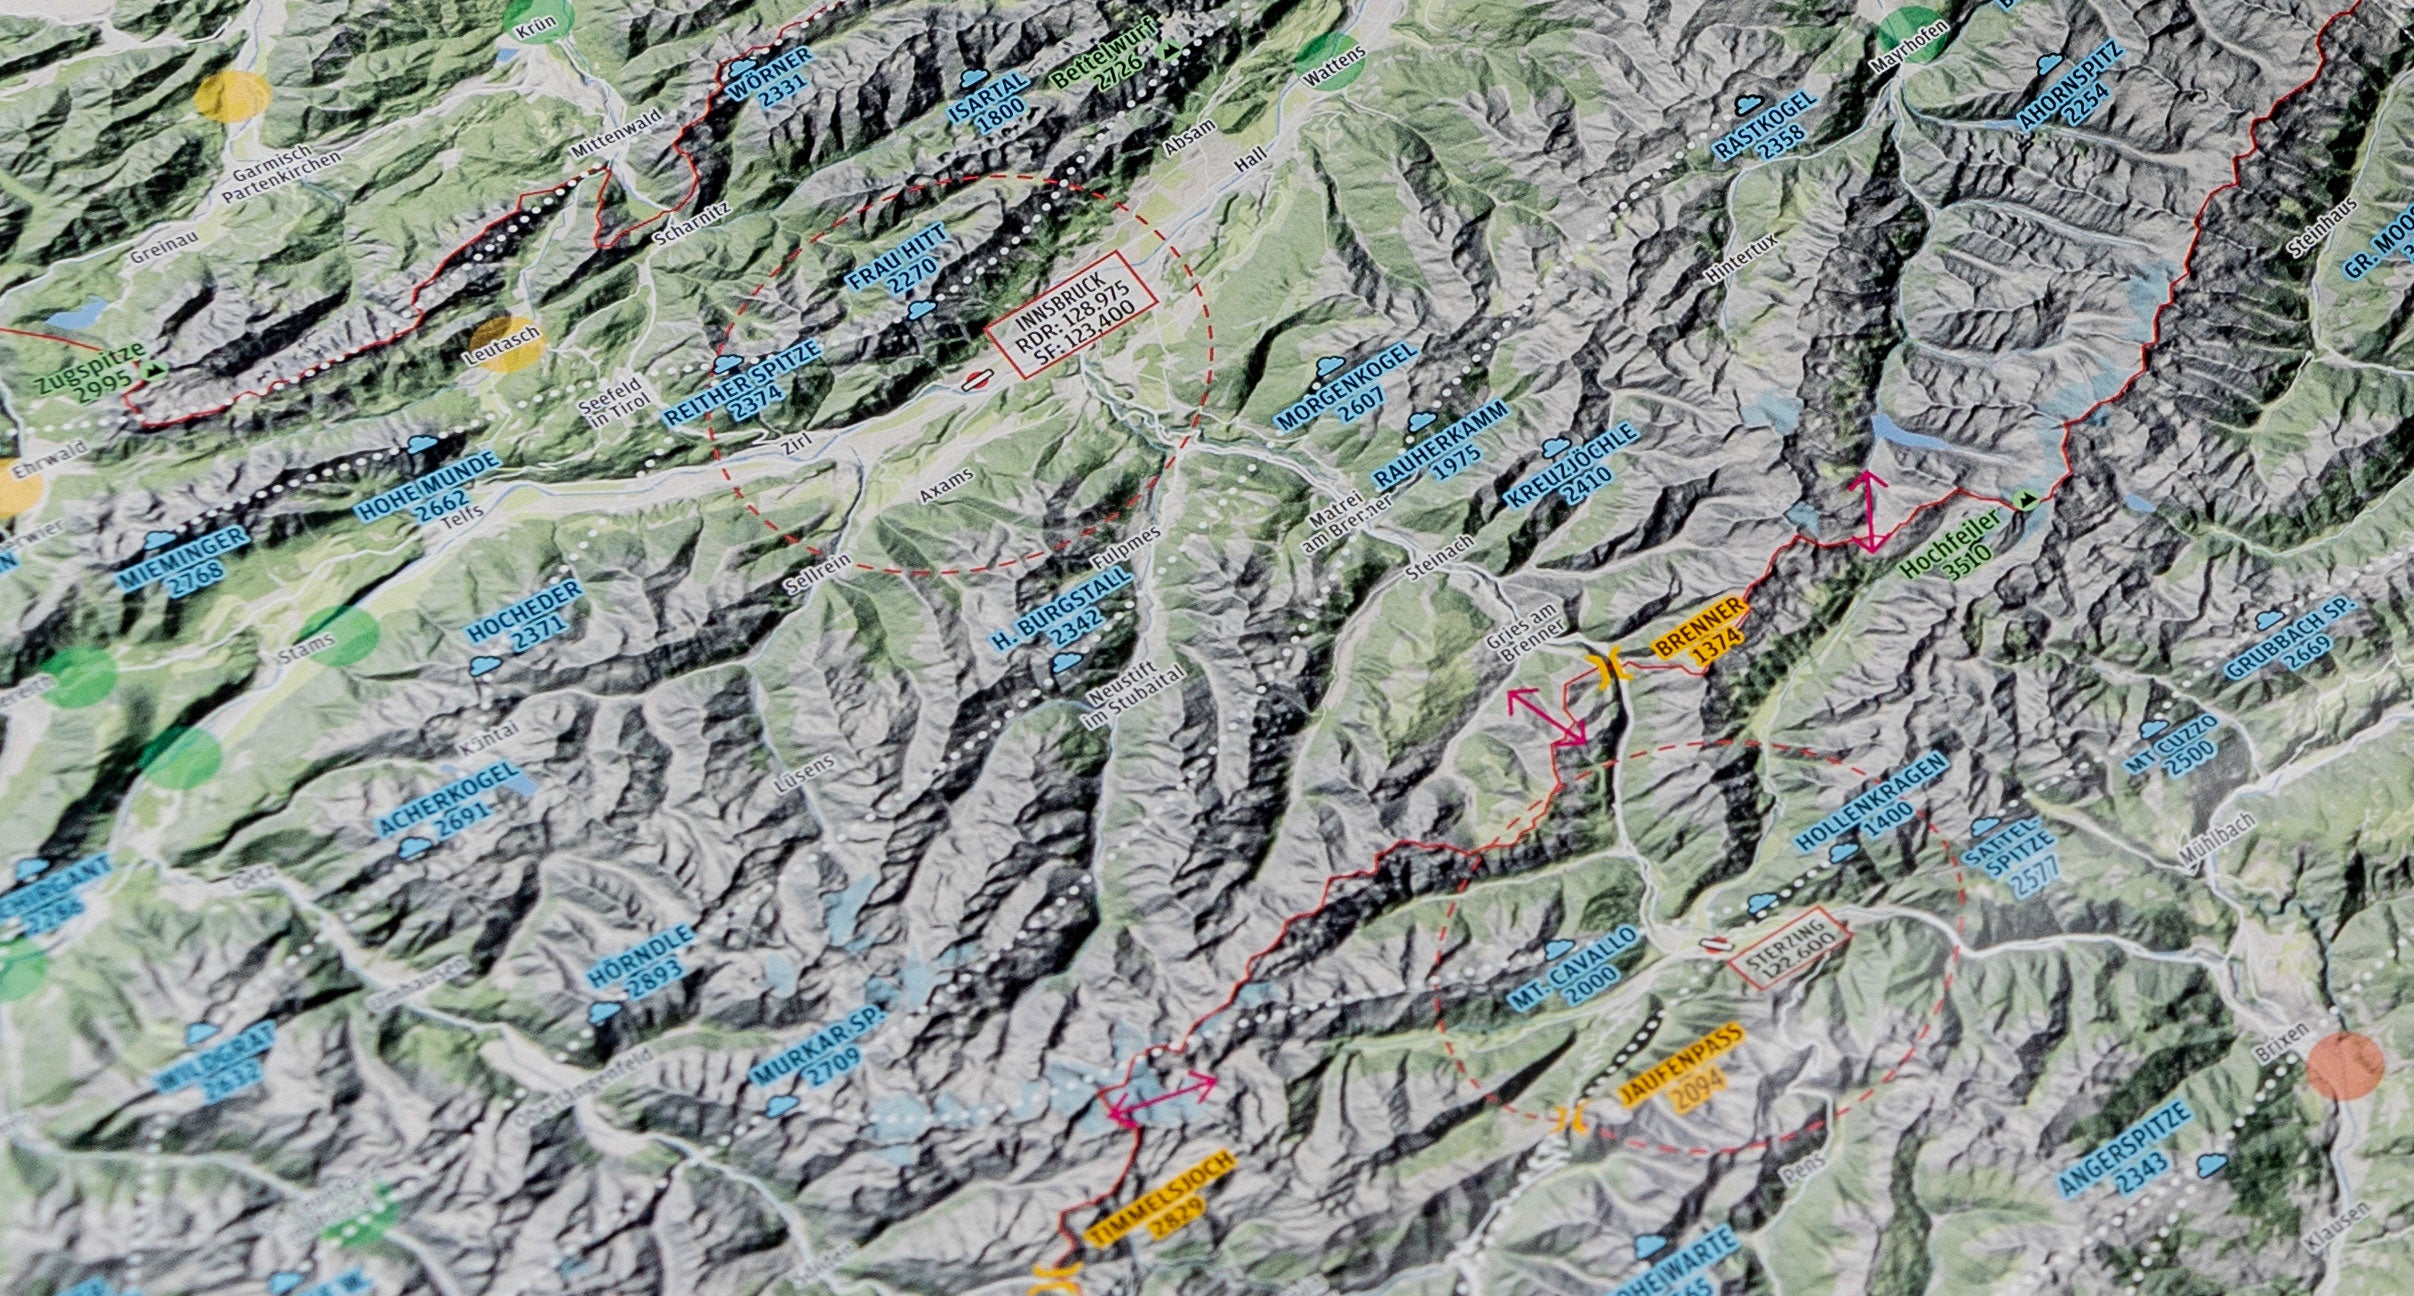
Valley wind systems
The map shows valley wind systems and their direction on a normal/low-wind, thermally active day. Most of the data was worked out and optimized with locals over a long period of time . Nevertheless, the complexity of the weather means that not all winds are recorded or that one or two arrows do not appear completely correct. There are clear areas and less clearly defined zones that can change significantly over the course of a day compared to our representation. Large-scale weather changes or stronger regional wind conditions influence some local systems more successfully than other areas.
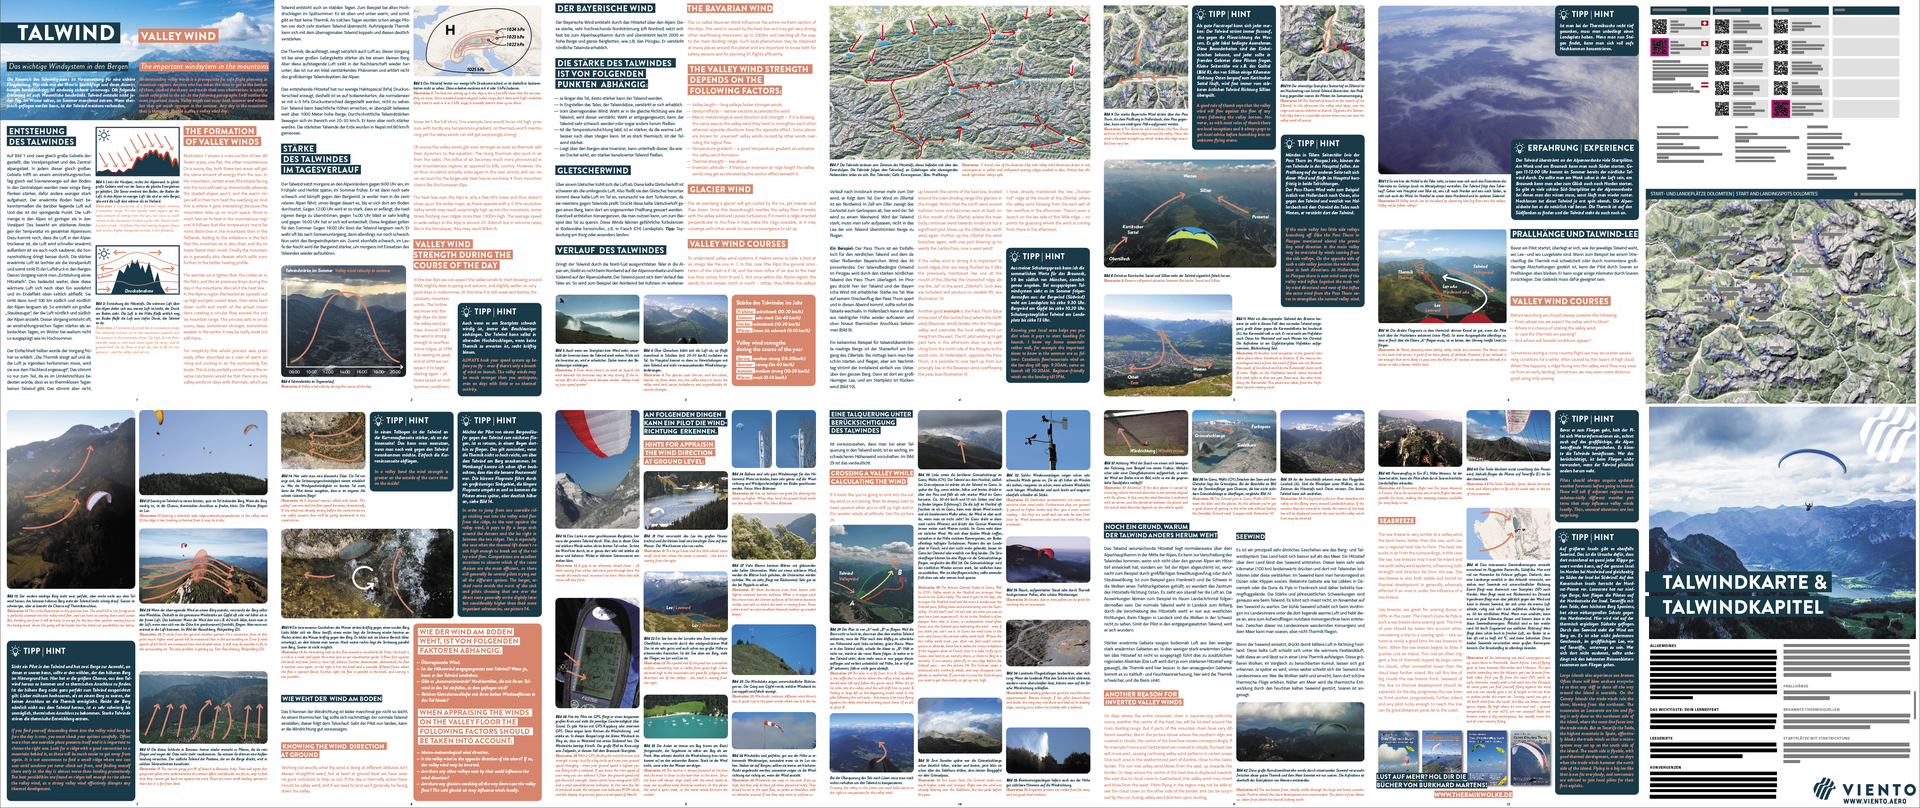
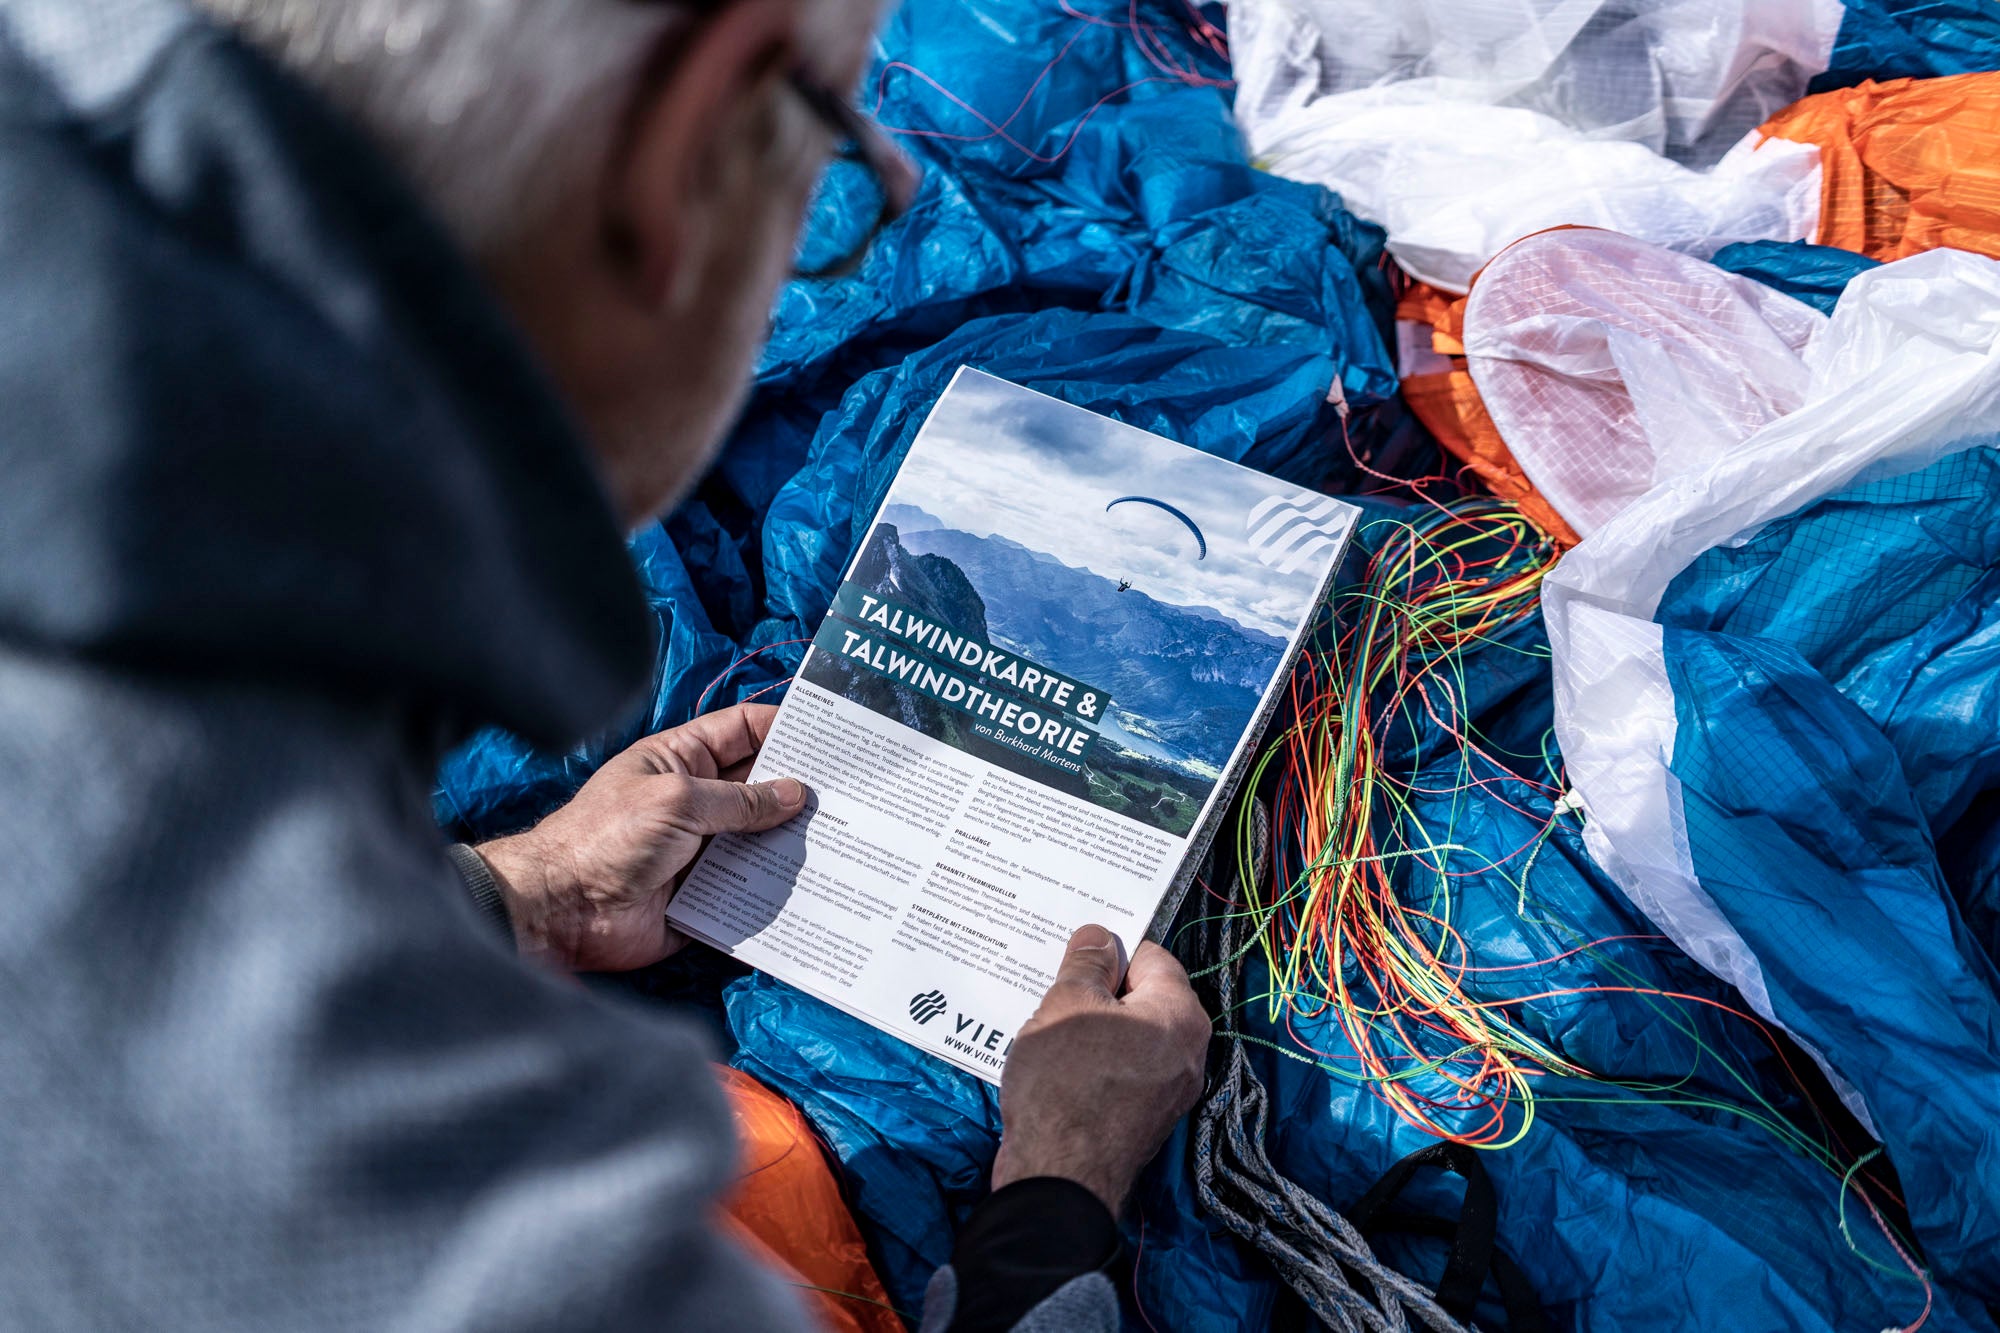
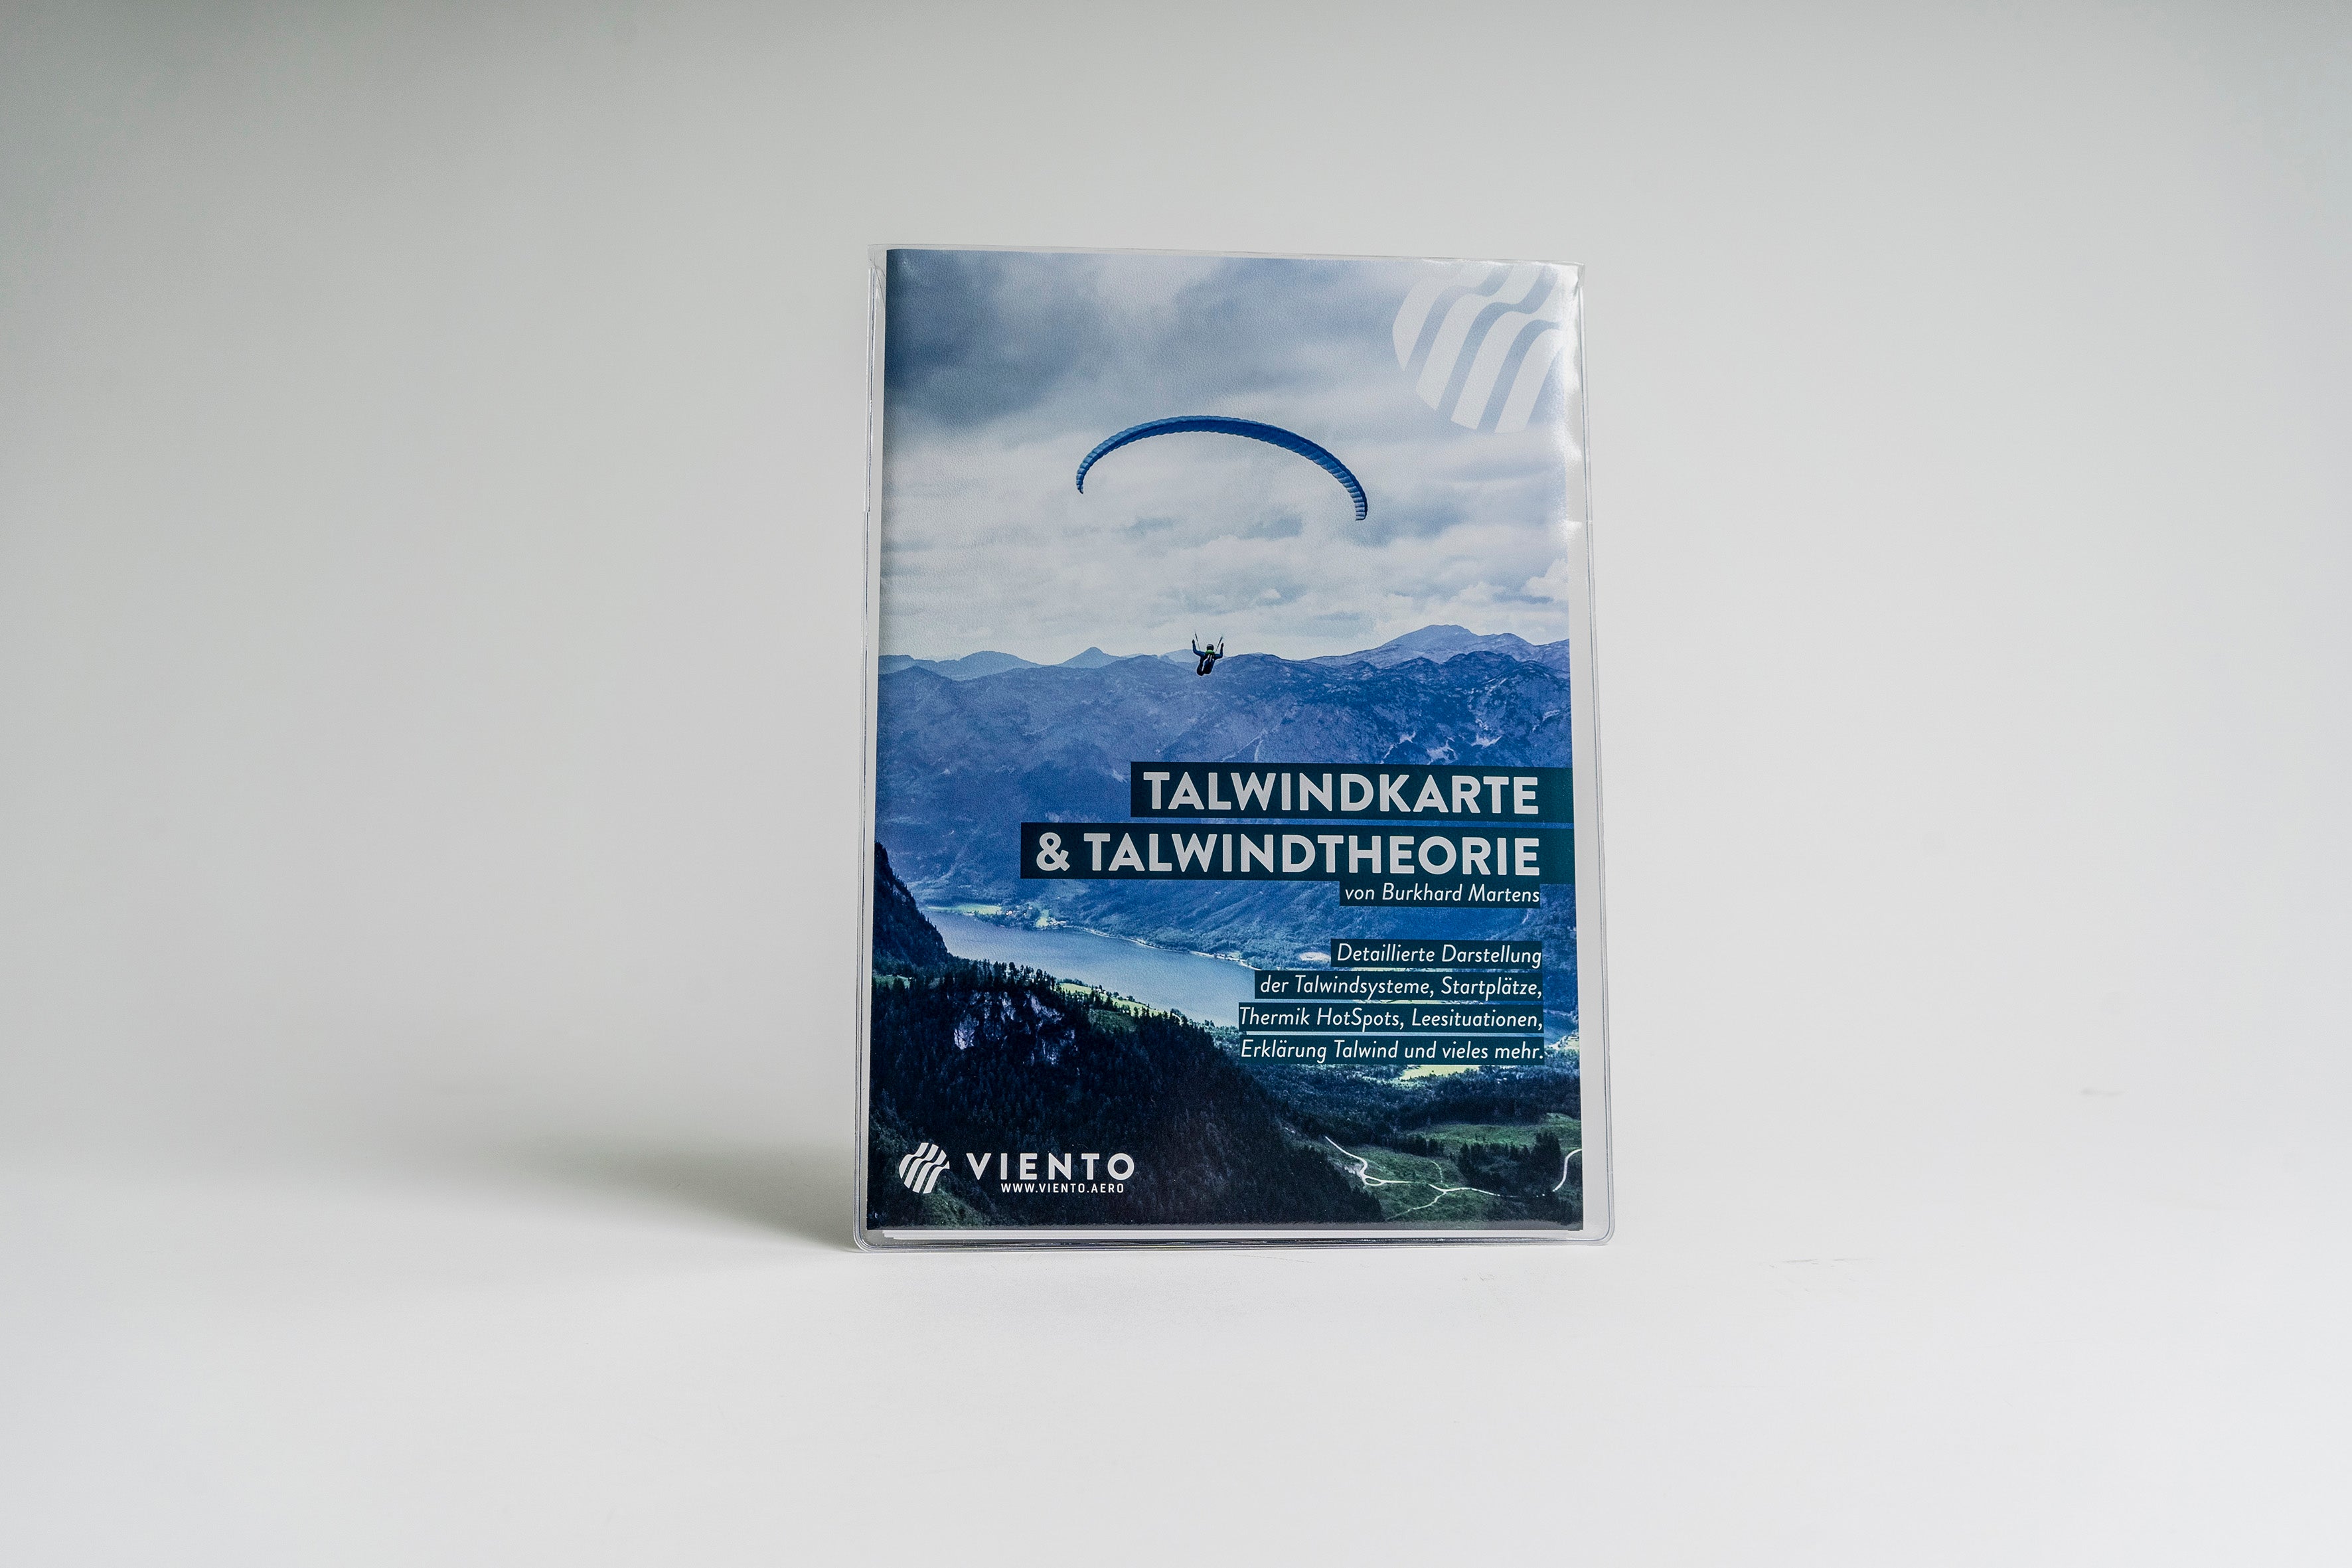
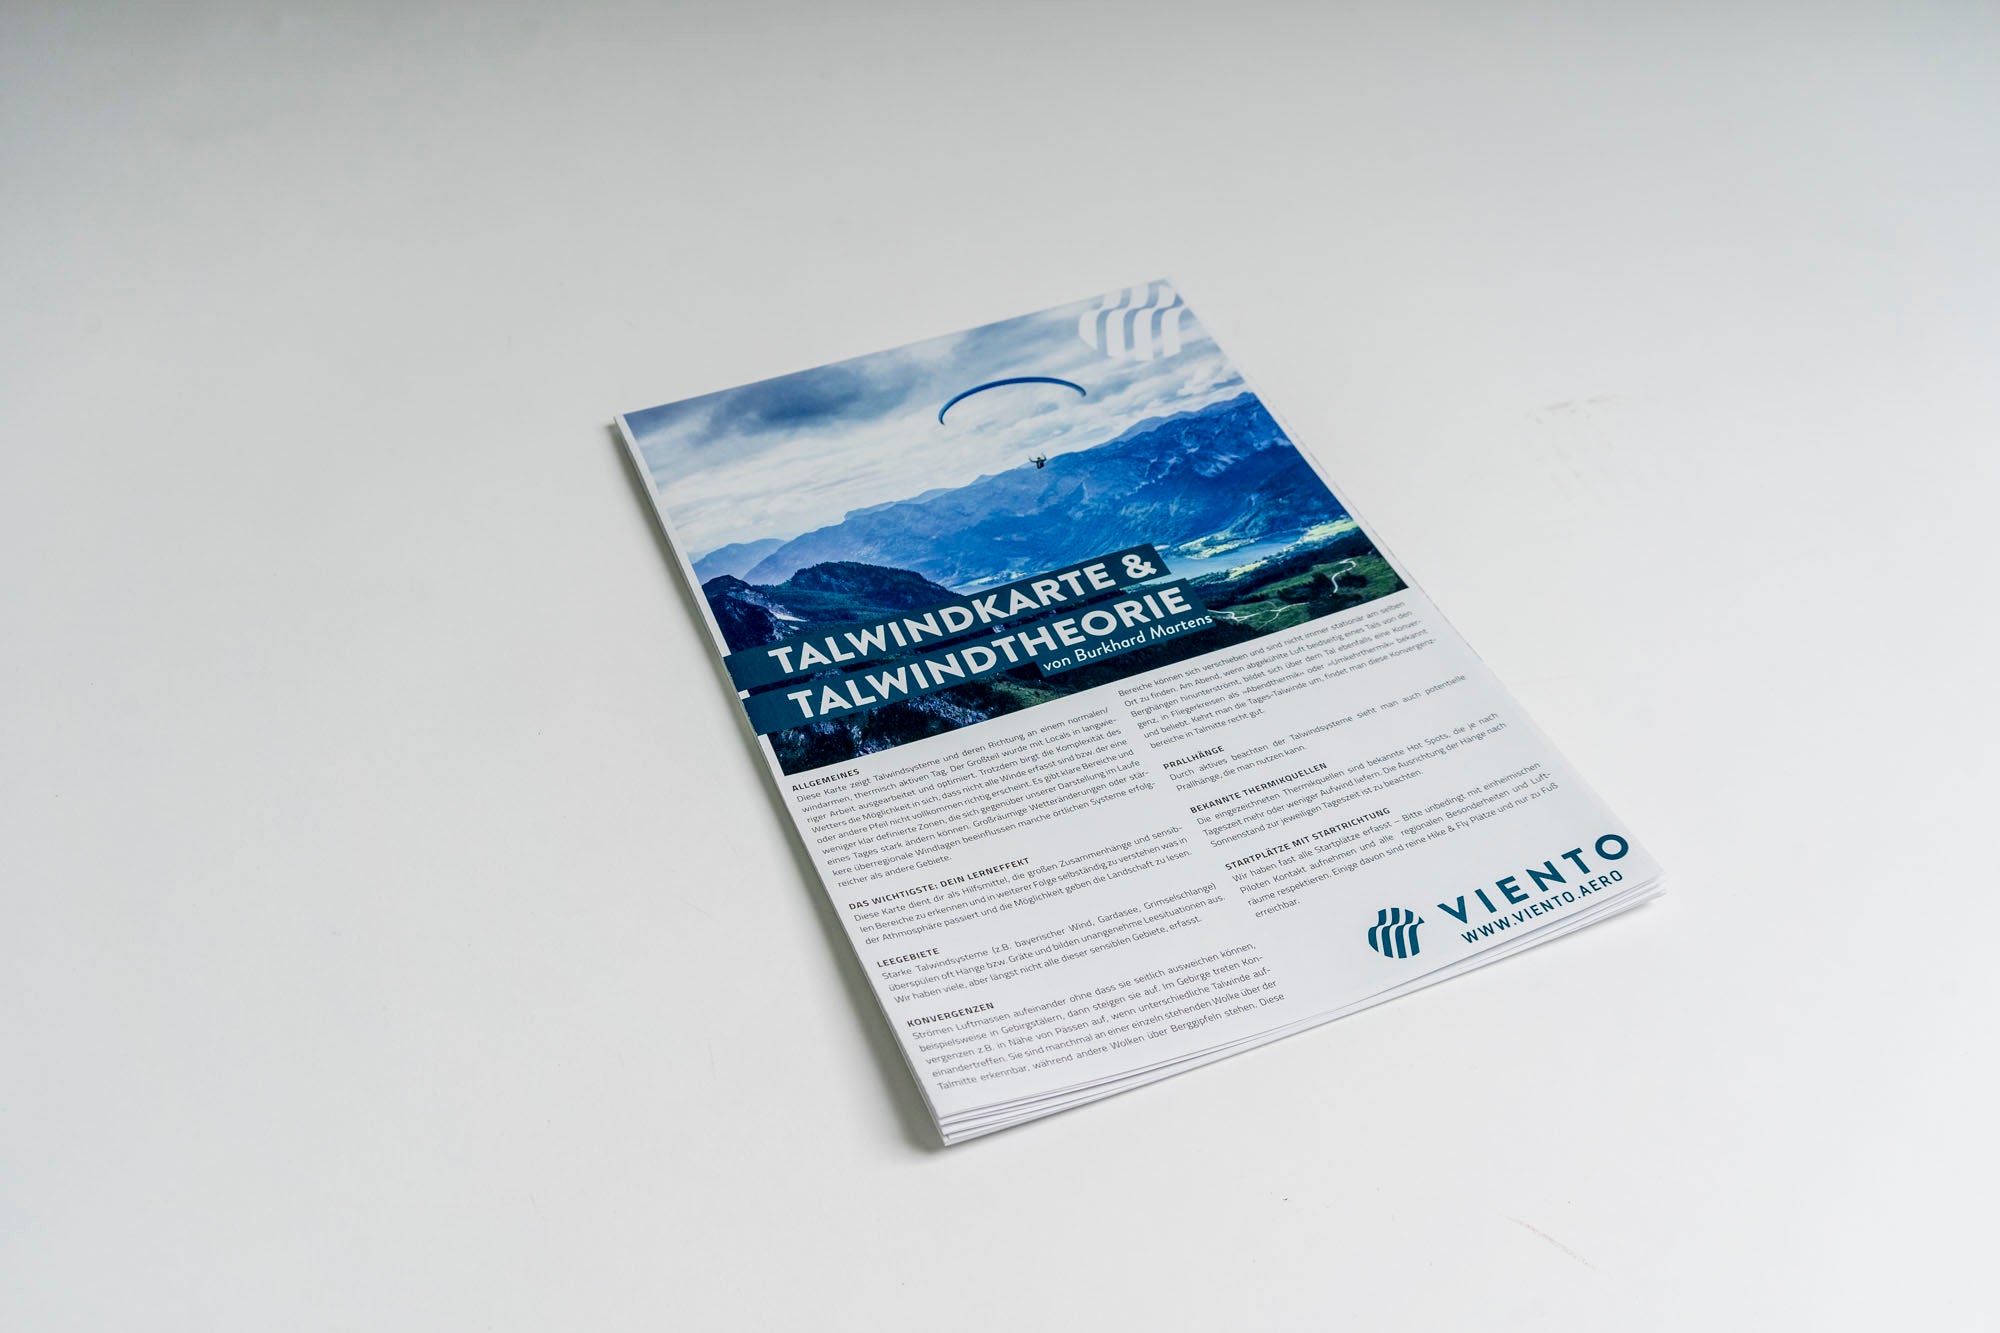
Valley wind theory by Burkhard Martens
The back cover with the complex explanation of the valley wind by Burkhard Martens (in DE and EN) leaves no questions unanswered and explains many things coherently and with extensive illustrations!
This map serves as a tool to help you identify the larger context and sensitive areas and then to understand what is happening in the atmosphere and to read the landscape. Slopes, convergences and lee areas can be identified at a glance.
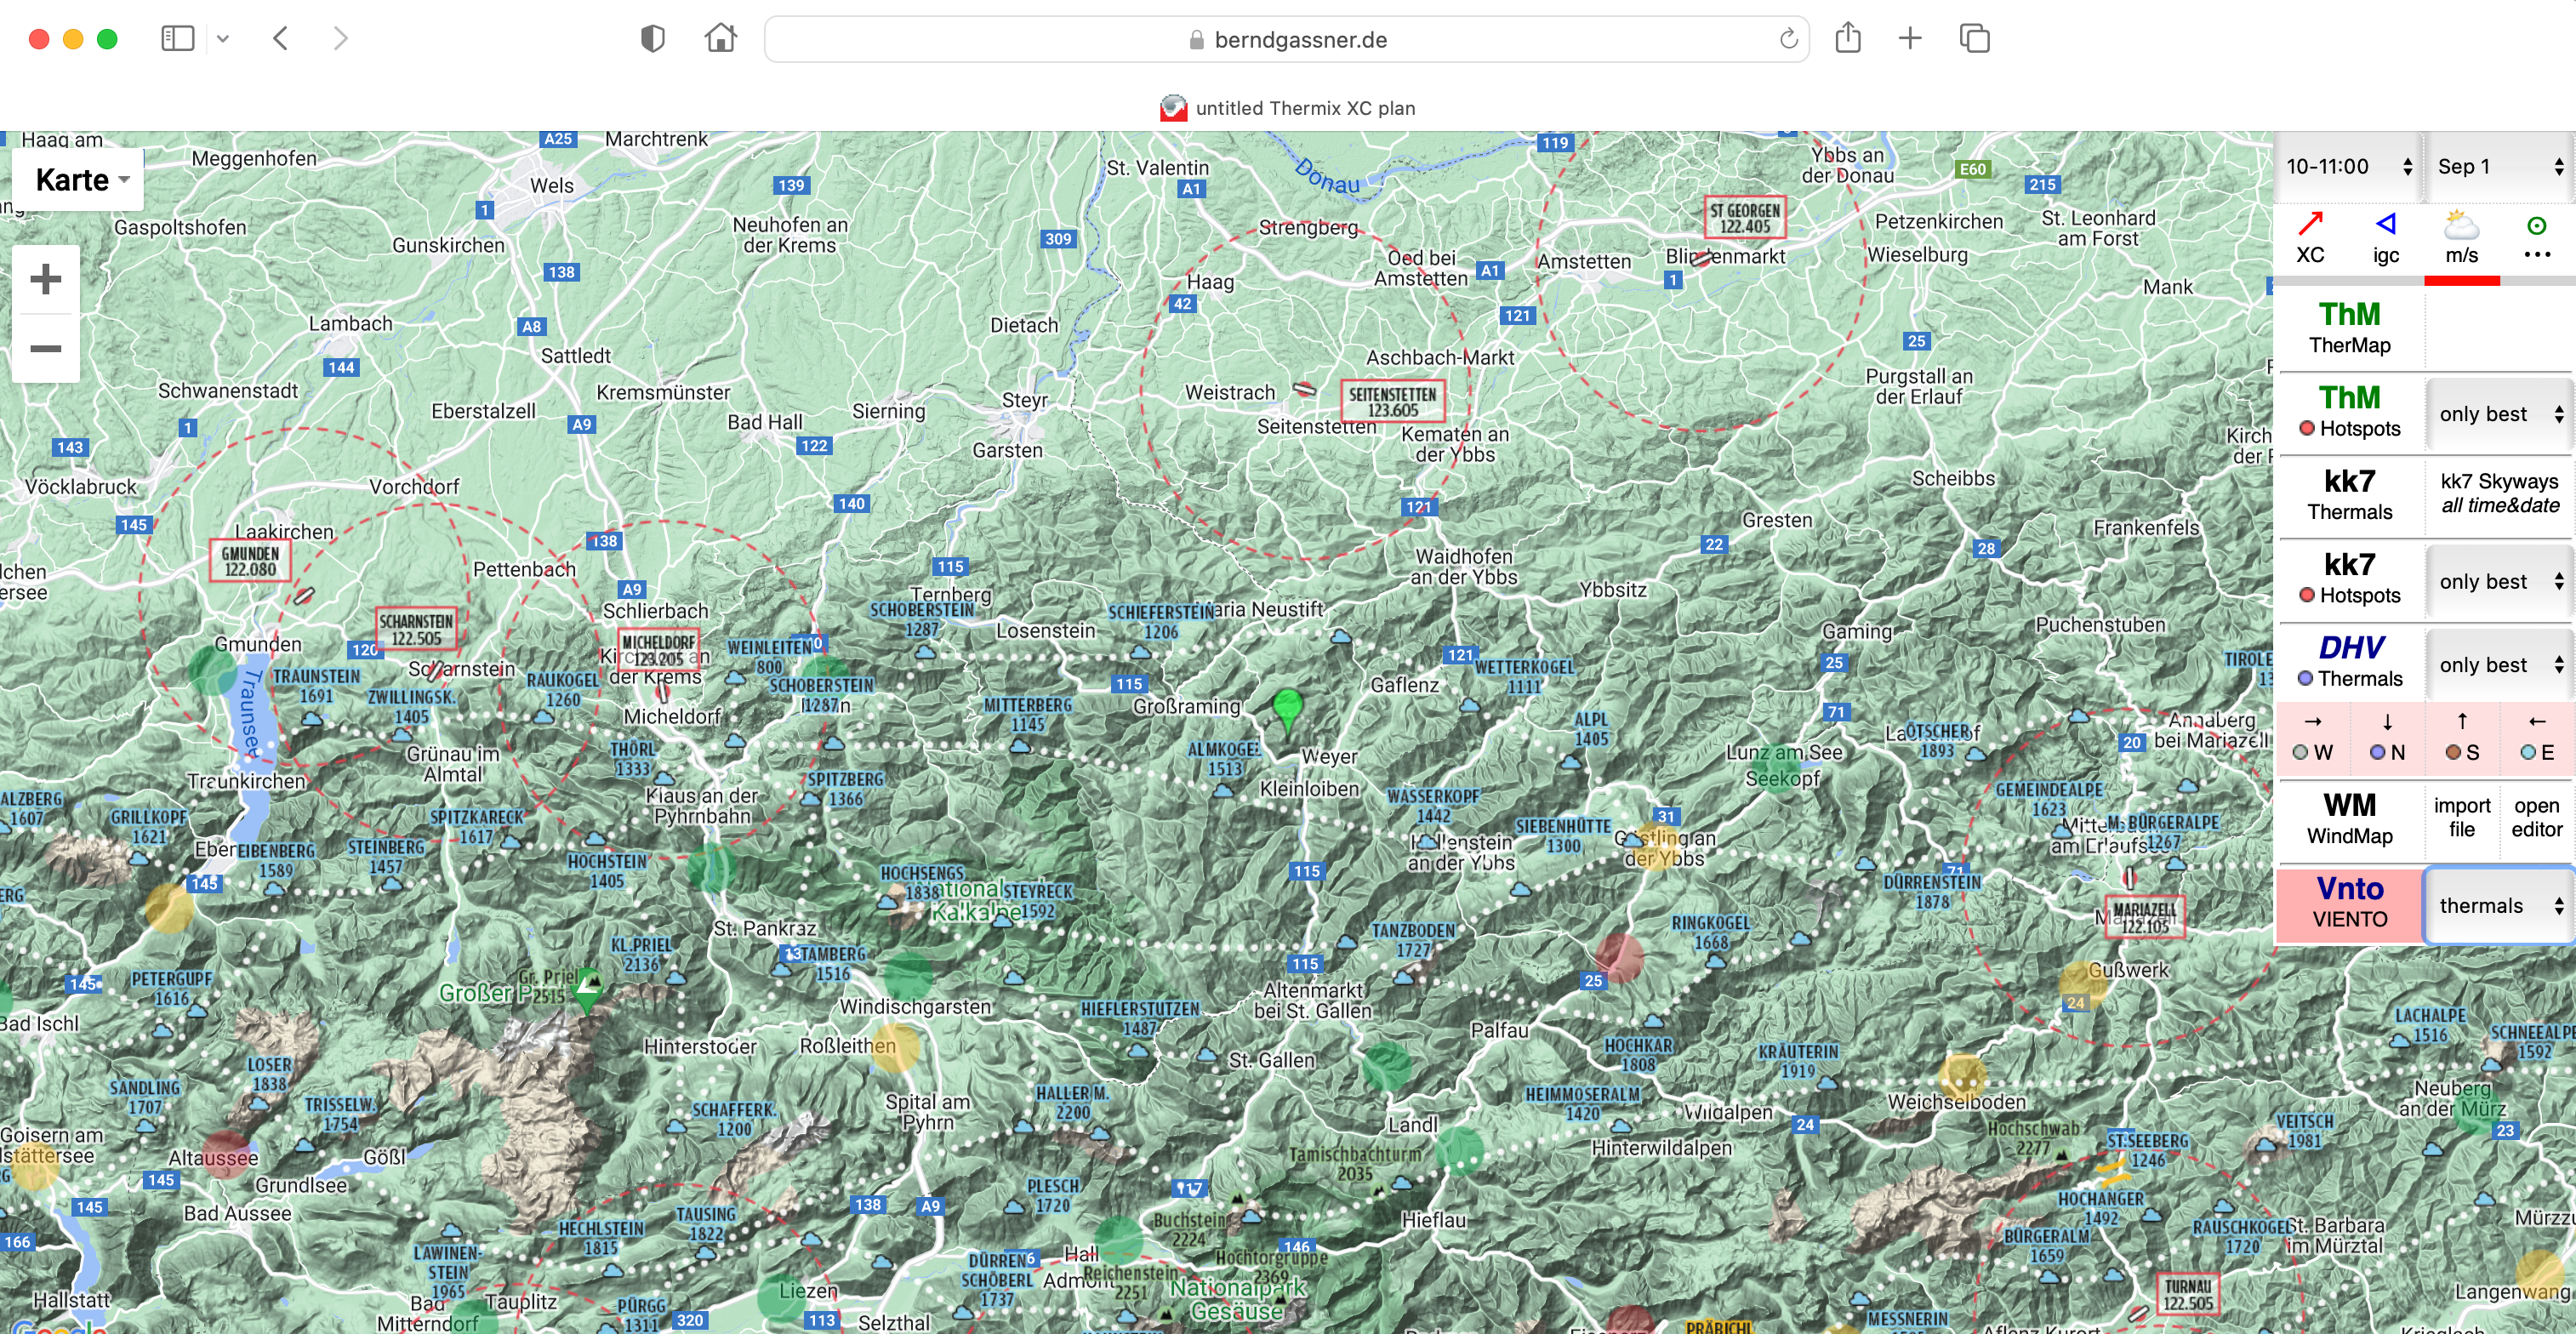
KK7 Skyway and Thermal Hotspots Maps
The well-known Skyways by KK7 (M. von Känel) show flight routes and routes frequently flown by paragliders and hang gliders, as well as thermal hotspots. Our map has a format of 930 x 380 mm, is folded into a small format for easy use and is printed on both sides. The clean presentation (only place names are shown) allows you to plan your flight on the map. The skyways and hotspots display makes flight planning easier for all "silent" pilots.

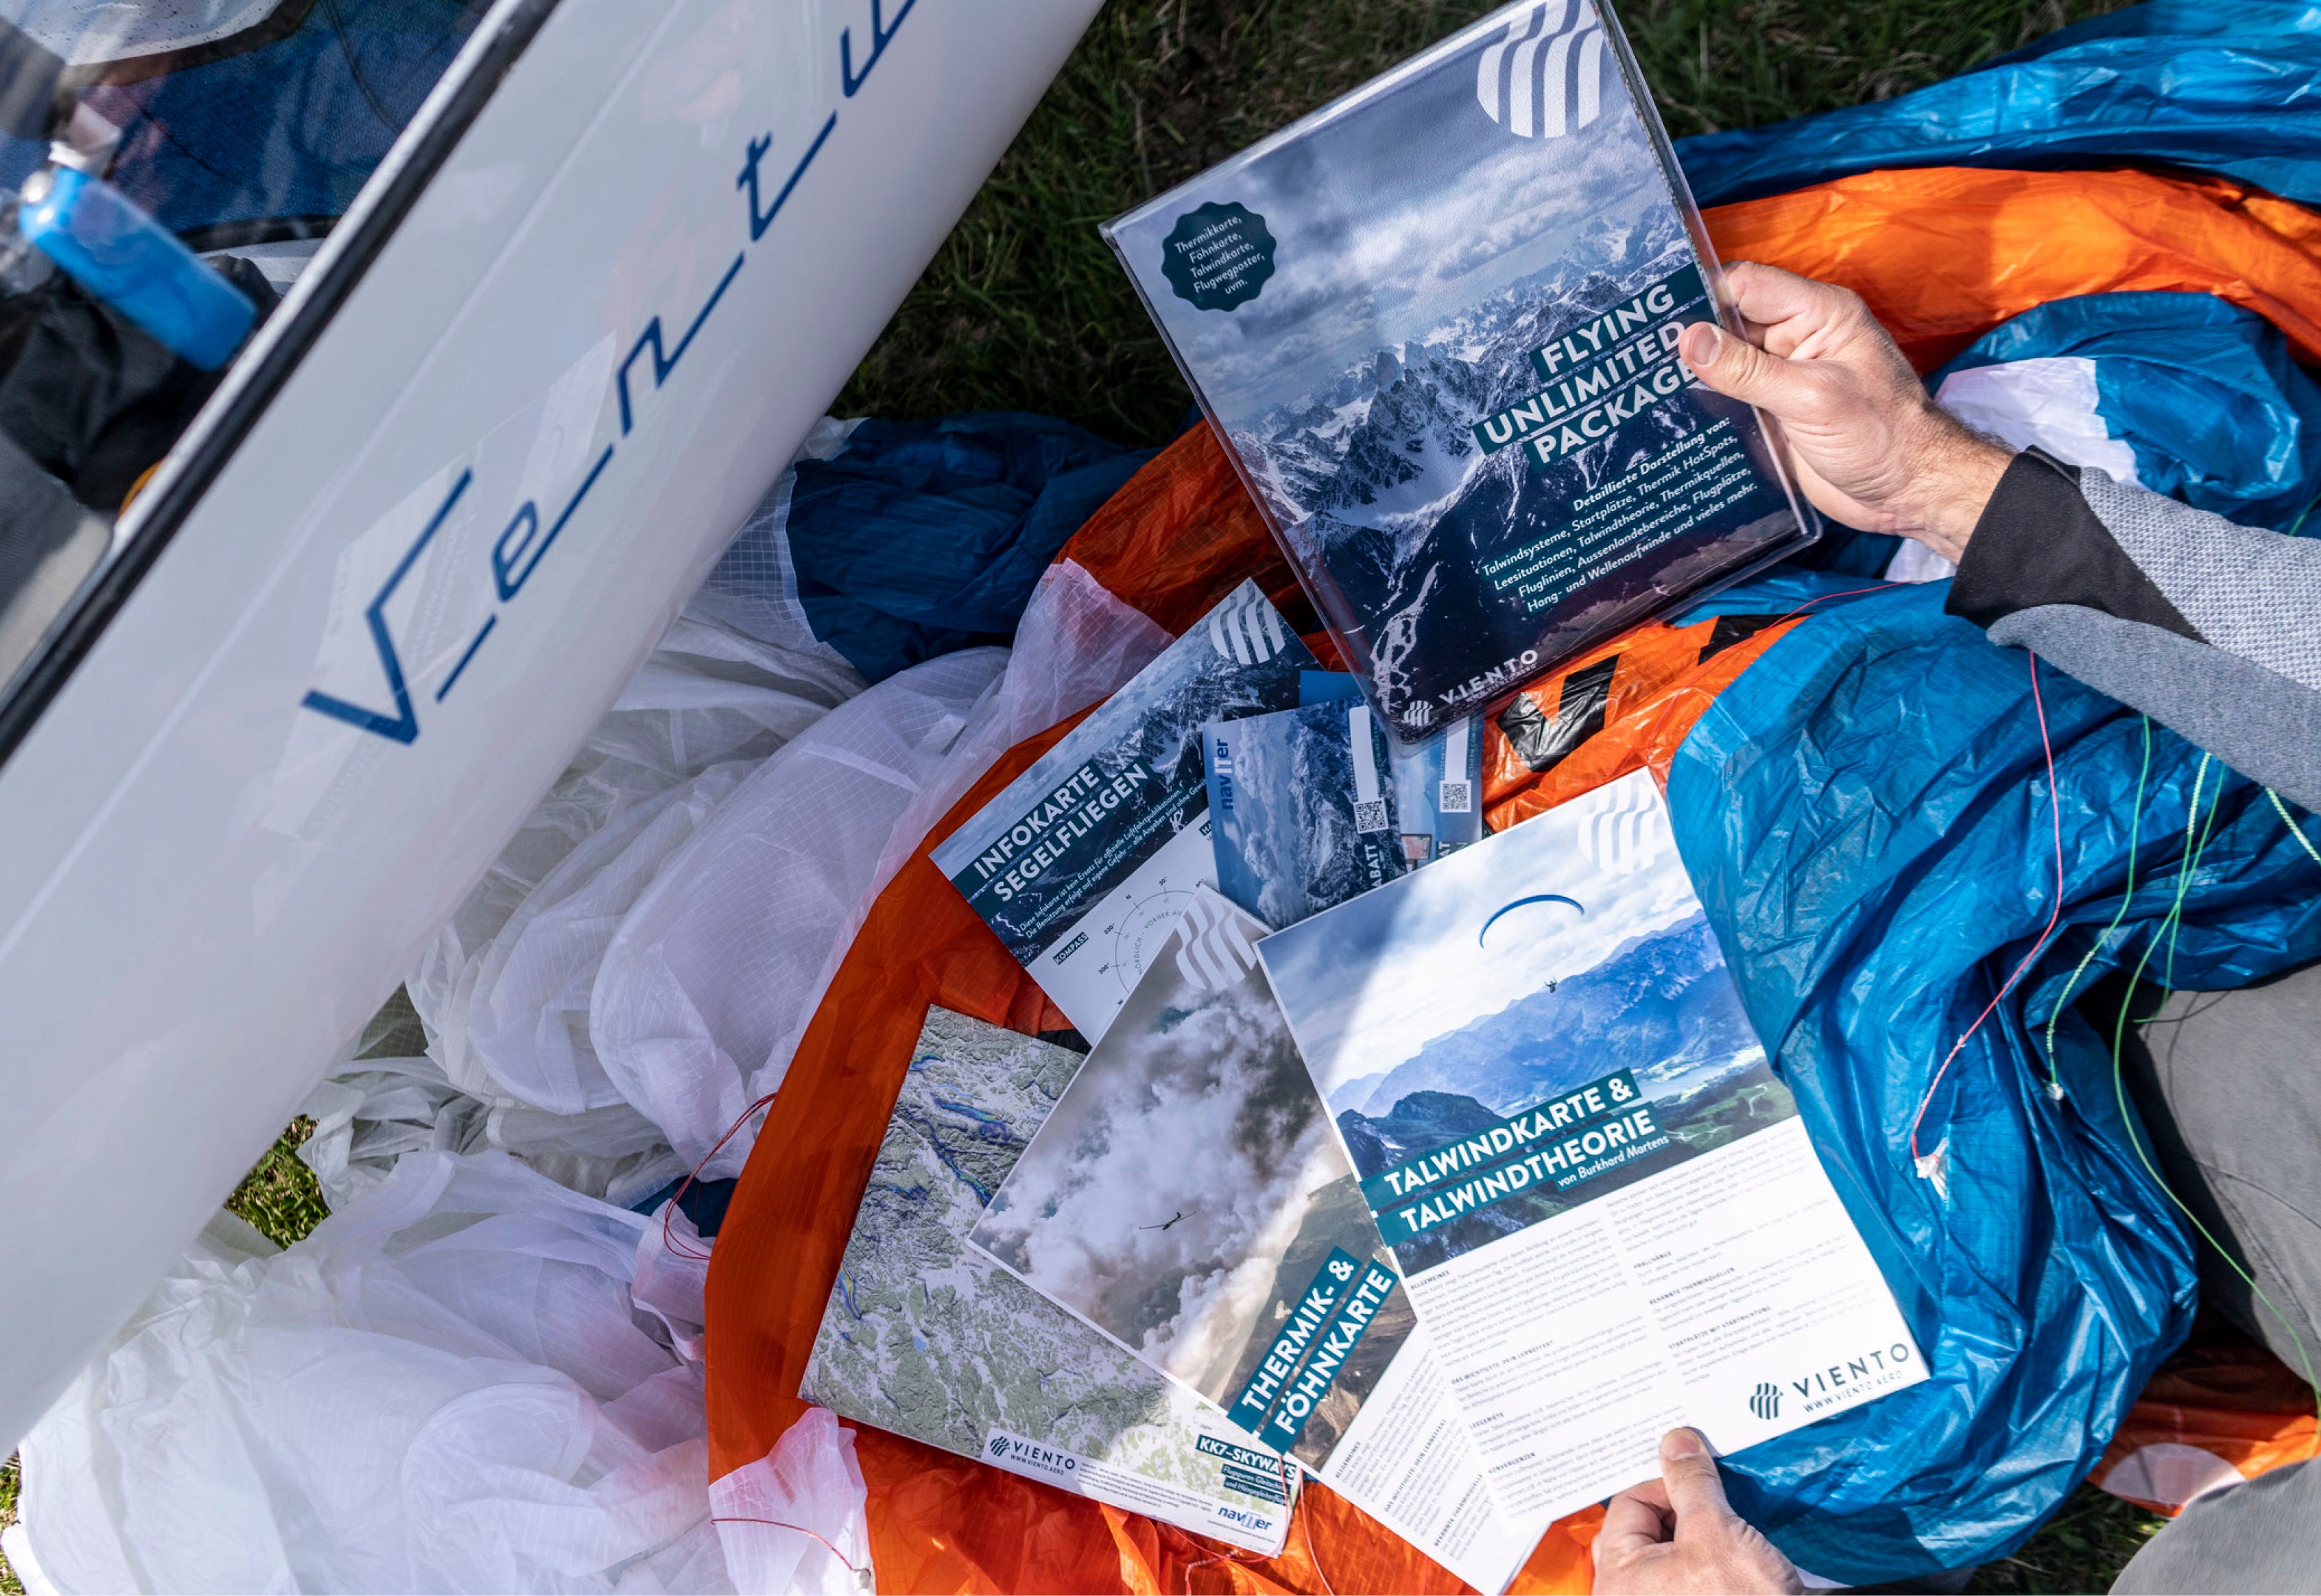
flying unlimited package | Super sampler »All you need« | bestoffer
Scope of delivery per package
1x Valley Wind Card
1x thermal/foehn map
1x KK7 skyways + hotspot map
1x Gliding information card
4x Vouchers: AIR Store, Naviter, XC Therm, viento
ONLINE tickets
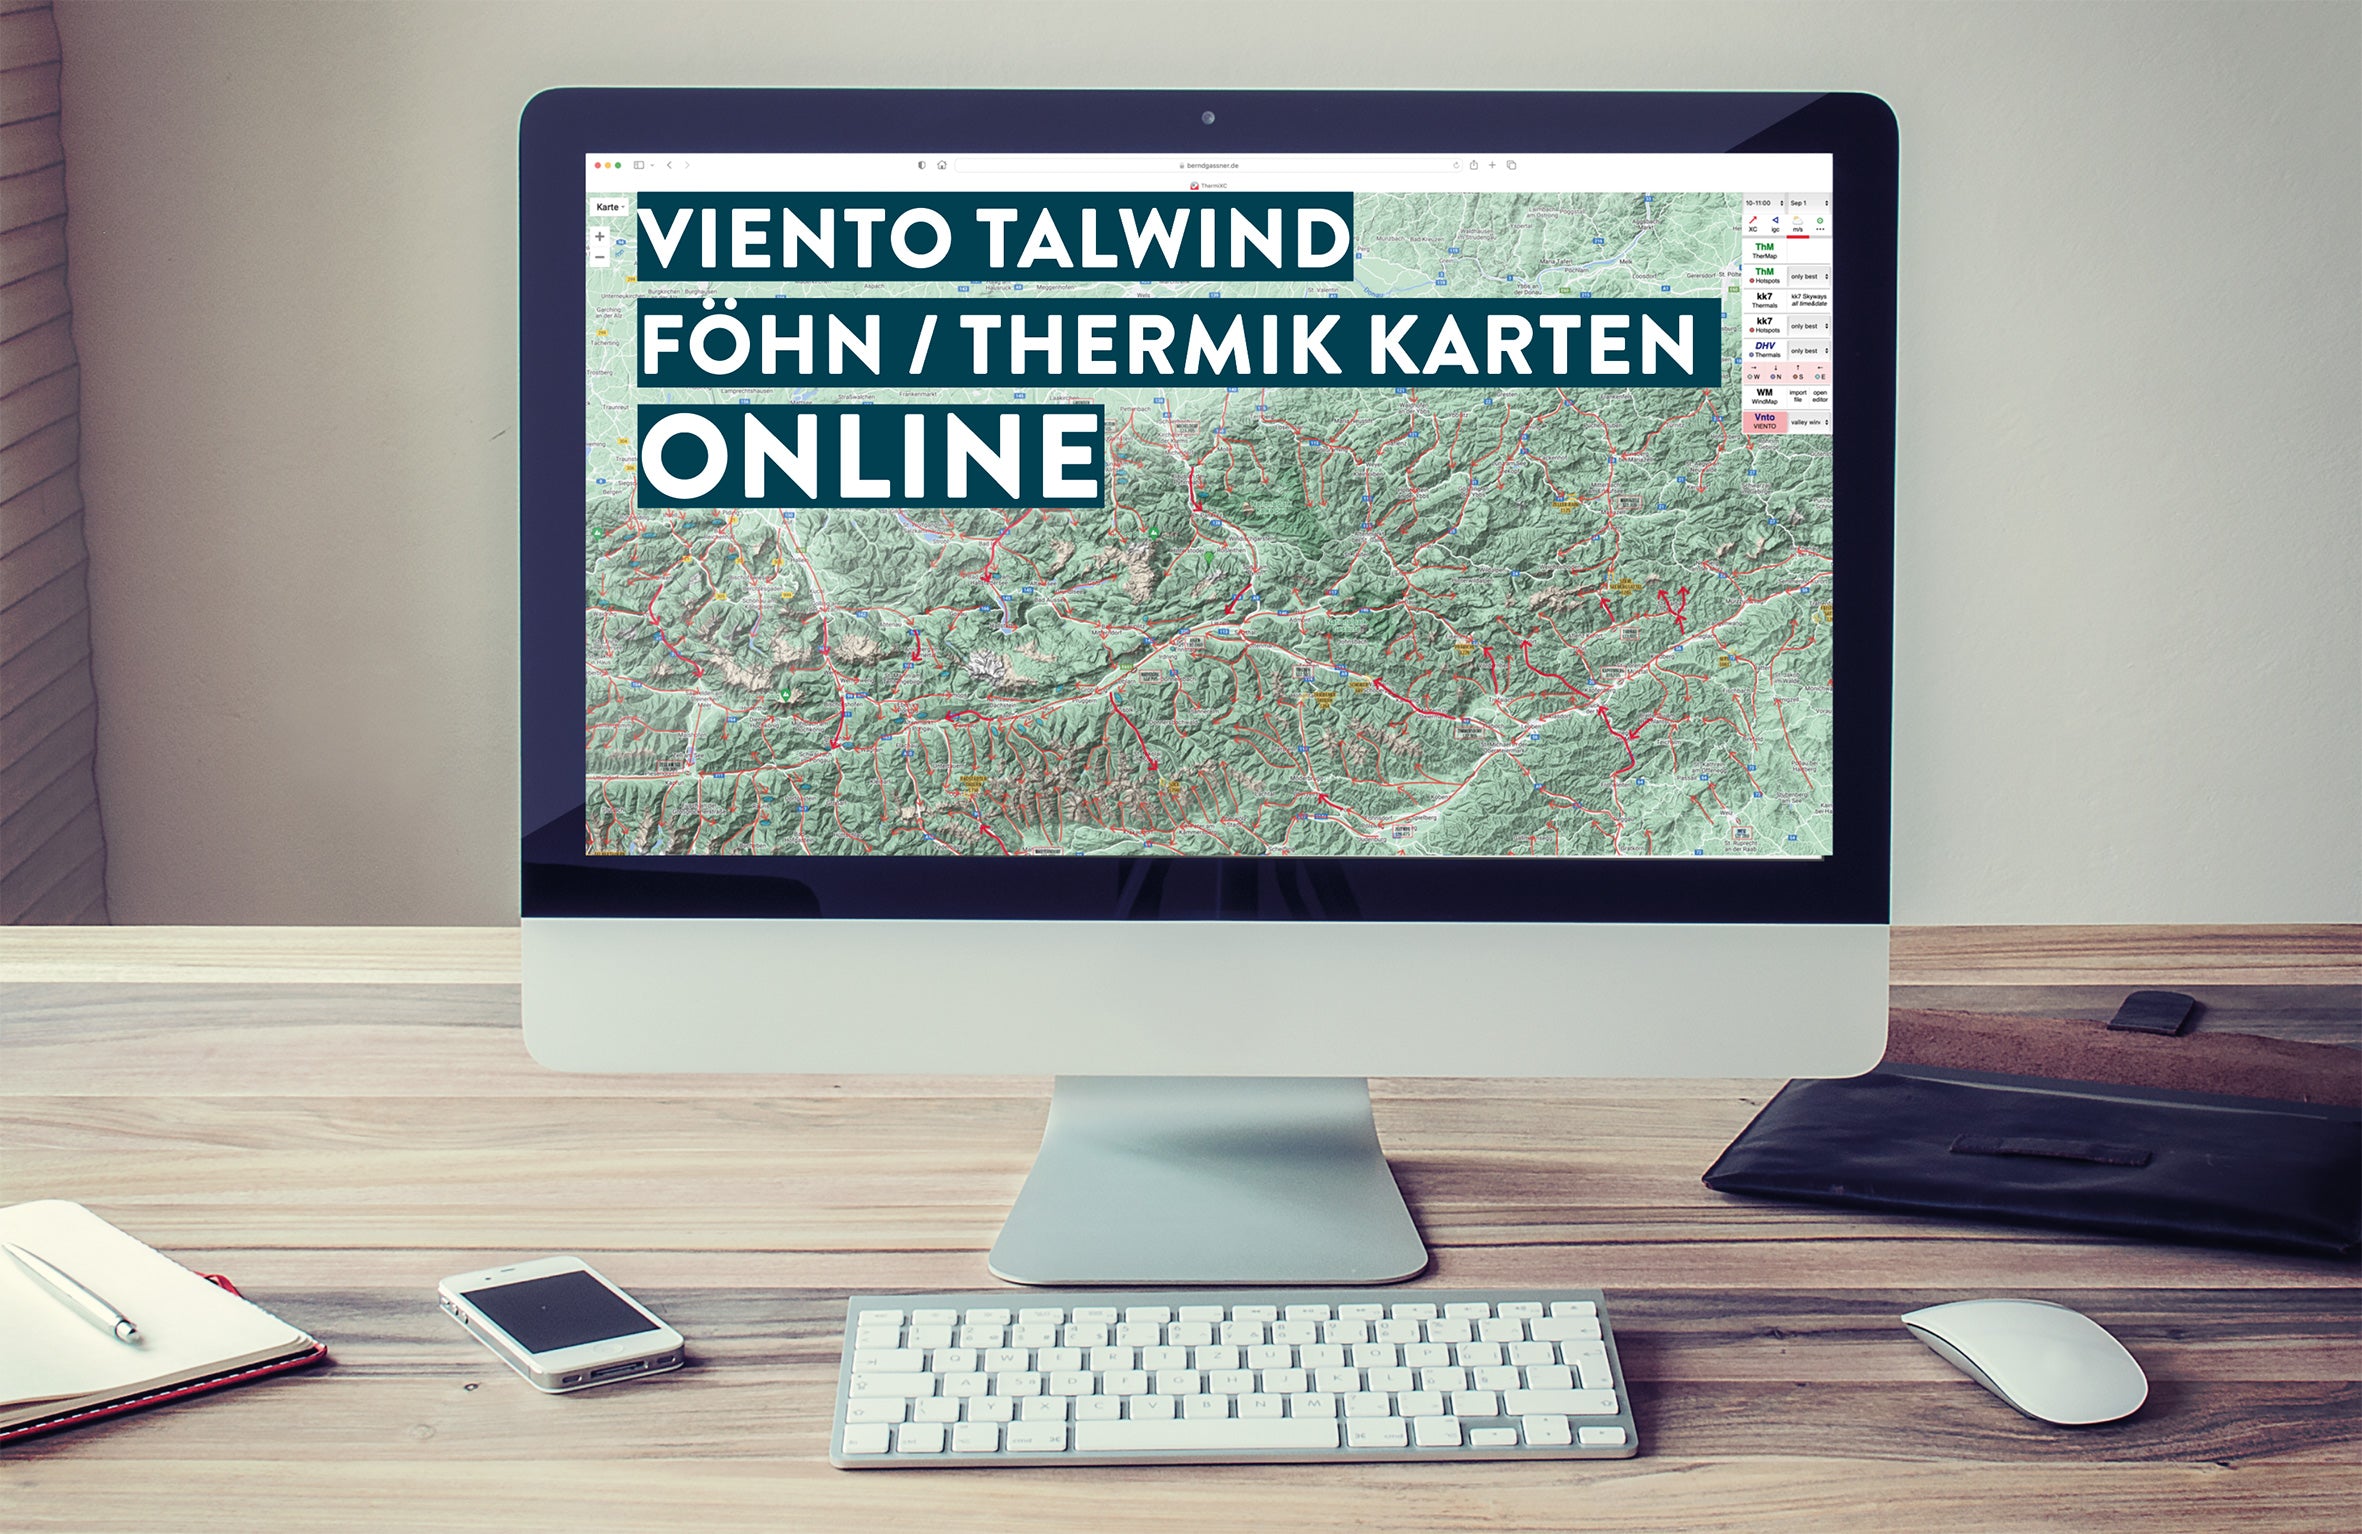
Our latest editions of the maps are now available online on the platform and the perfect planning tool from Bernd Gassner | THERMIXC.
We have succeeded in transferring all of our content to THERMIXC. This includes all of the content on our maps (except for Burkhard Martens' Talwind chapter) - all enhanced with THERMIXC's complex planning tools.
